
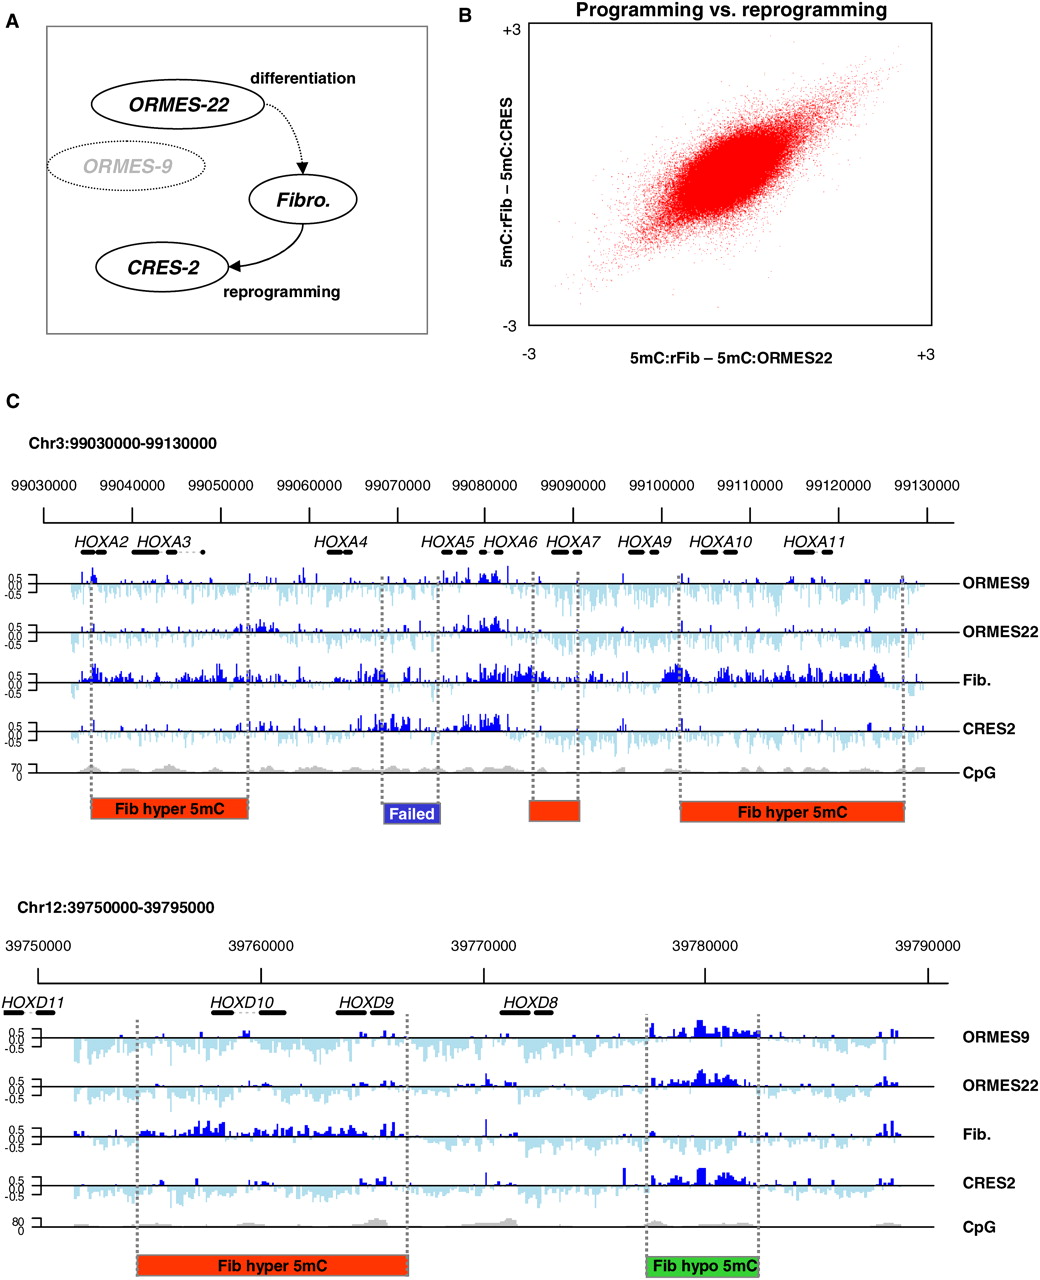
Profiling monkey ES methylation. (A) Experimental design. We studied DNA methylation in native ESCs (ORMES-22), fibroblasts, and ESCs generated by somatic cell nuclear transfer (CRES-2). We also assayed a distinctly different native ES line (the homozygous parthenote ORMES-9) to control for ES line-specific effects. DNA methylation profiles in these four cell types were assayed using MeDIP and tiling arrays. Values of zero correspond to average genomic methylation. (B) Near perfect DNA methylation reprogramming in CRES-2. Shown are the differential methylation values for 380,000 array probes covering orthologous human K4–K27 bivalent domains and selected DNA methylation hotspots. The differences between fibroblasts and the two stem cell lines are highly correlated, showing that at the global level, reprogramming of the fibroblast epigenome during nuclear transfer is near perfect. (C) Conserved and differential methylation in HOX clusters. Shown are the methylation profiles at the (upper) HOXA and (lower) HOXD clusters, which were tiled completely on our array and reflect an excellent overall correlation between the native and reprogrammed ESCs. Regions undergoing fibroblast (red) hypermethylation (hyper-DMRs) or (green) hypomethylation (hypo-DMRs) are highlighted. In contrast to the good overall correspondence between native and reprogrammed ESC methylation, a (blue) small region in the HOXA cluster shows a CRES-2 methylation pattern that is similar to the fibroblast profile, suggesting incomplete reprogramming or independent hypomethylation in OMRES-22 and ORMES-9.


