
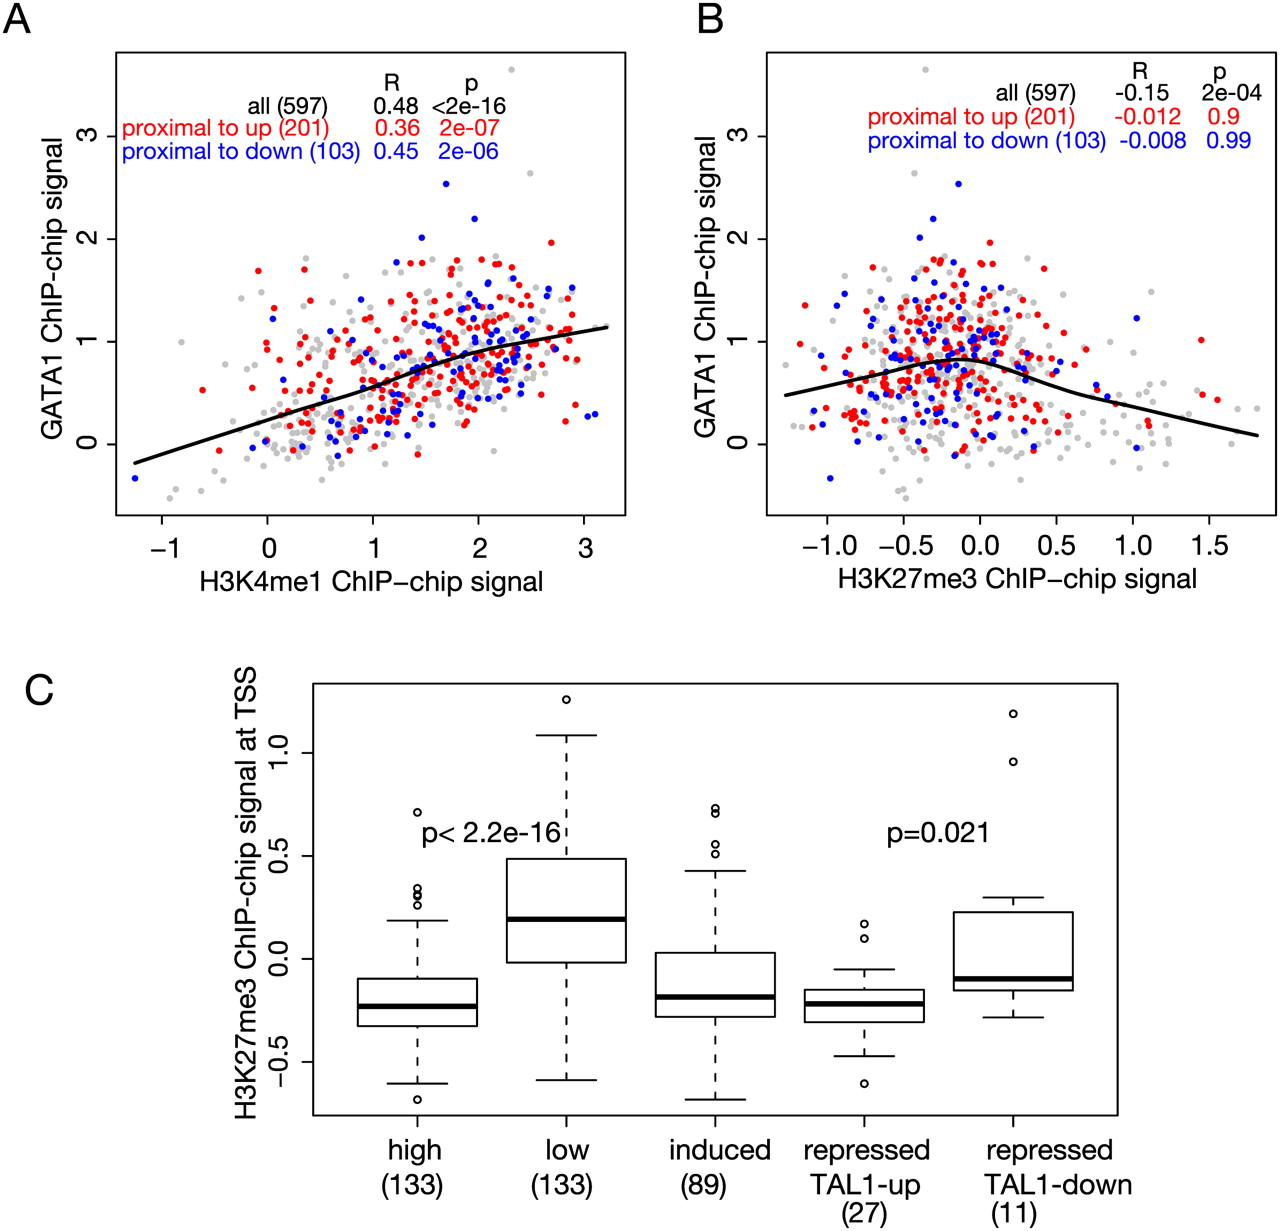
Correlations of histone modifications with occupancy and transcriptional status. (A,B) Scatterplots showing the correlation of GATA1 occupancy (proxied by mean ChIP-chip signal on the y-axis) with the levels of monomethylation of histone H3K4 (H3K4me1, x-axis in A) or with levels of trimethylation of histone H3K27 (H3K27me3, x-axis in B) in each GATA1 OS. The histone modifications were determined in G1E-ER4 cells treated with estradiol. Colors of the dots for GATA1 OSs are red for those associated with up-regulated genes, blue for those associated with down-regulated genes, and gray for all other GATA1 OSs in the 66-Mb region of chromosome 7. The lowess line is for all the data points, and correlations for the different expression categories are given in the inset table in each graph. (C) Boxplot comparing the distributions of H3K27me3 around the TSS of genes in the indicated expression categories. The mean levels of the histone modification around the TSS for each gene in a category were computed. The distributions are significantly different when comparing the high (top quartile of expression levels from the transcriptome analysis) versus low expressed genes (bottom quartile) (P < 2.2 ×10⁻¹⁶) and repressed genes distinguished by co-occupancy between GATA1 and TAL1 (TAL1-down vs. TAL1-up, P = 0.021), using a single-tailed t-test. The numbers of genes in each category are given in parentheses.


