
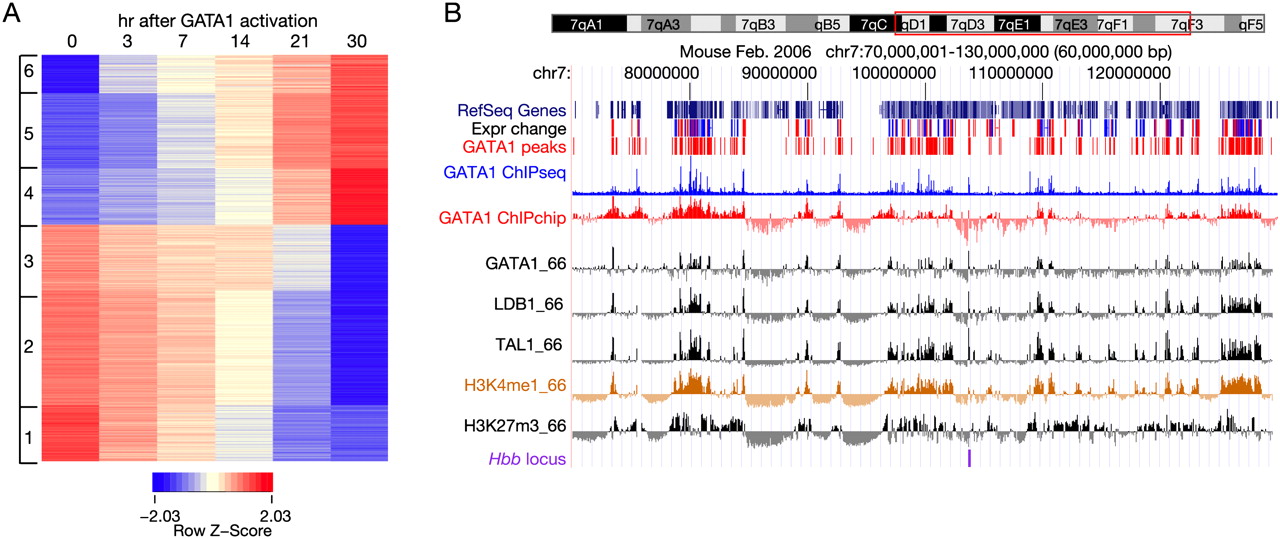
Gene expression response and chromosomal DNA occupancy after restoring GATA1 in erythroid cells. (A) The expression patterns of GATA1 responsive genes are portrayed as a heat map, with red indicating higher levels and blue indicating lower levels of expression for each gene. Each row represents the expression level of one gene at the time points after induction indicated for each column. The hybridization signals from three replicates at each time point were averaged, and the log (base 2) of the average signals were normalized in each row to generate a Z-score. The data matrix was clustered using the k-means method with k = 6; the results show three clusters of up-regulated genes and three clusters of down-regulated genes (indicated on the left). (B) Large-scale view of expression response, occupancy by transcription factors, and repressive histone modification in erythroid cells. For a 60-Mb region of mouse chromosome 7 centered on the Hbb gene complex (outlined in red on the ideogram at the top), the tracks of data show (in order) RefSeq genes, indicators of the change in expression level (red for up- and blue for down-regulation) in response to restoration of GATA1, the genome-wide GATA1 peak calls, the ChIP-seq data for GATA1 after peak calling by MACS (blue), the raw ChIP-chip hybridization signals for GATA1 (tracks labeled GATA1_HD2 for the genome-wide data and GATA1_66 for chromosome 7 data), TAL1 and LDB1 occupancy, the raw ChIP-chip hybridization data for monomethylation of H3K4 and trimethylation of H3K27, and the location of the Hbb locus (purple). (Expr change) Change in expression level; (GATA1 peaks) those deduced from the genome-wide ChIP-chip data. The image was generated on a customized installation of the UCSC Genome Browser (Kent et al. 2002).


