
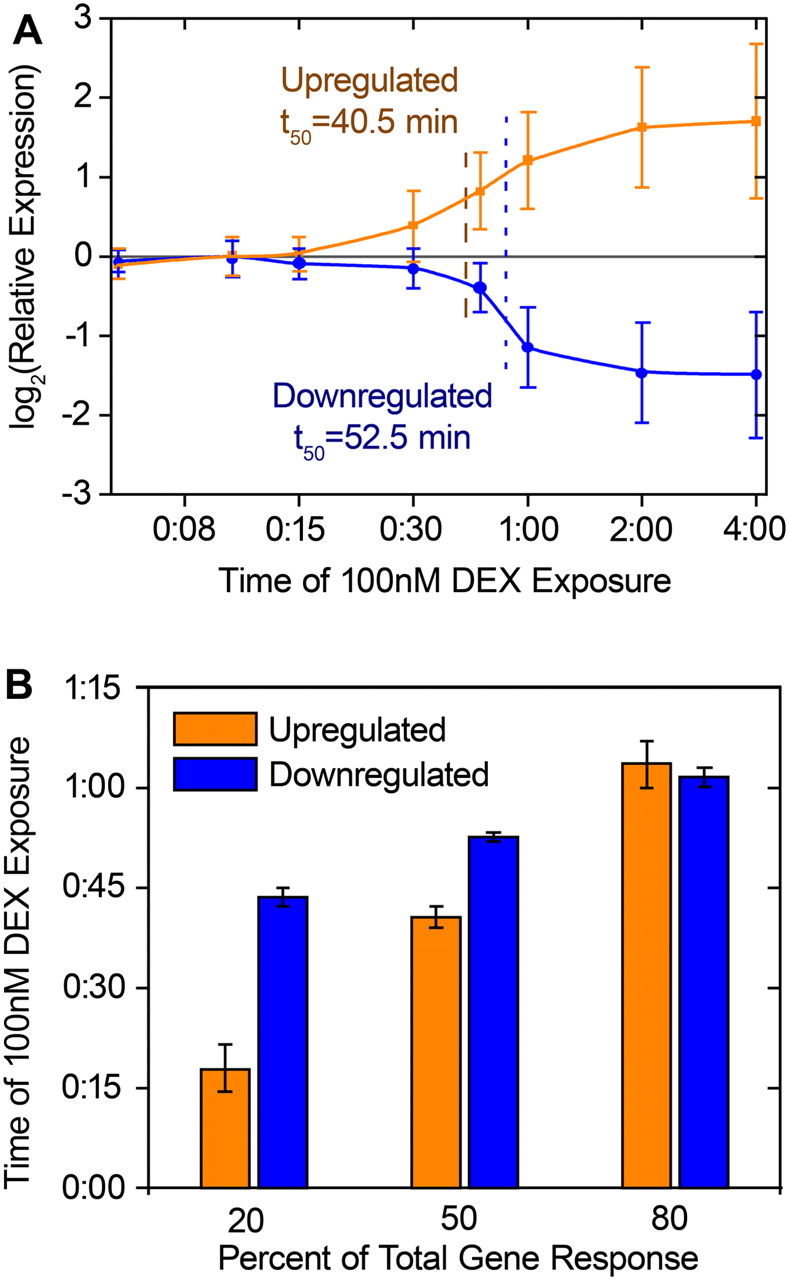
Figure 4.
Time-course response to dexamethasone. Gene expression response, measured with RT-QPCR, of DEX-responsive genes over increasing duration of exposure to 100 nM DEX treatment. (A) Average gene expression response (y-axis) across the time-course (x-axis). Error bars, SD. Fifty percent response time for up- and down-regulated genes are indicated with dashed and dotted lines, respectively. (B) Time of exposure to 100 nM DEX required to achieve 20%, 50%, and 80% response for up-regulated (orange bars) and down-regulated (blue bars) genes. Error bars, SE in each parameter from curve fitting.


