
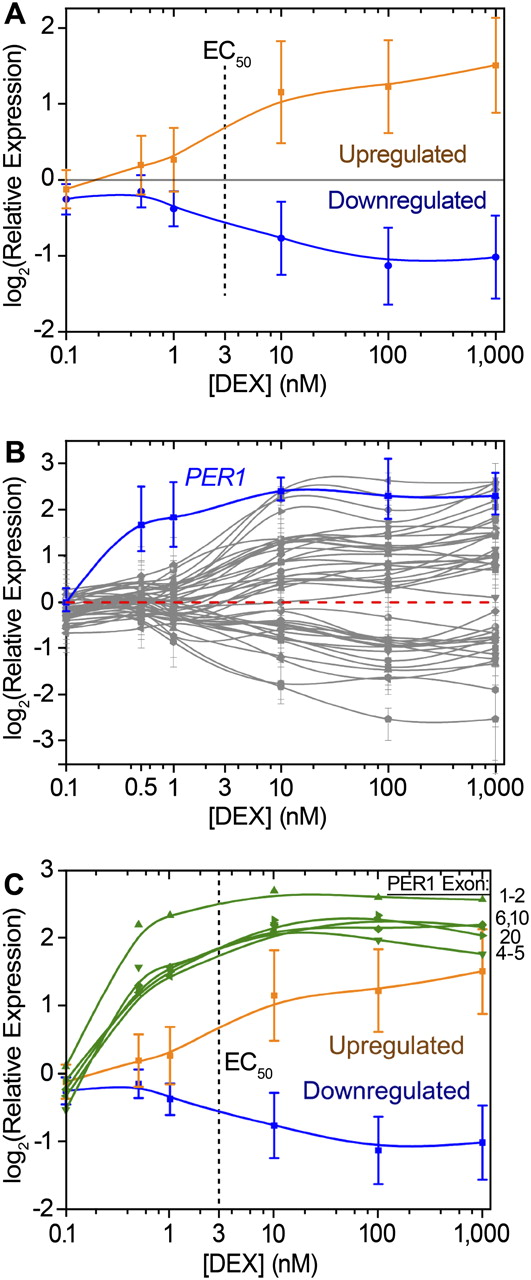
Dose response to dexamethasone. (A) Gene expression response, measured with RT-QPCR, of DEX-responsive genes in response to treatment with increasing concentrations of DEX. The up-regulated genes (orange line) and down-regulated genes (blue line) showed similar response, with EC50 ∼ nM (dashed line). Error bars, SD. (B) PER1 (blue line) is particularly responsive to low concentrations of DEX, compared with all other genes measured (gray lines). Error bars, maximum and minimum over three biological replicates. (C) PER1 dose response (green lines) verified with primers designed against various exons and exon–exon junctions, as indicated. For comparison, the overall response of activated (orange line) and repressed genes (blue line) is reproduced. Error bars, SD.


