
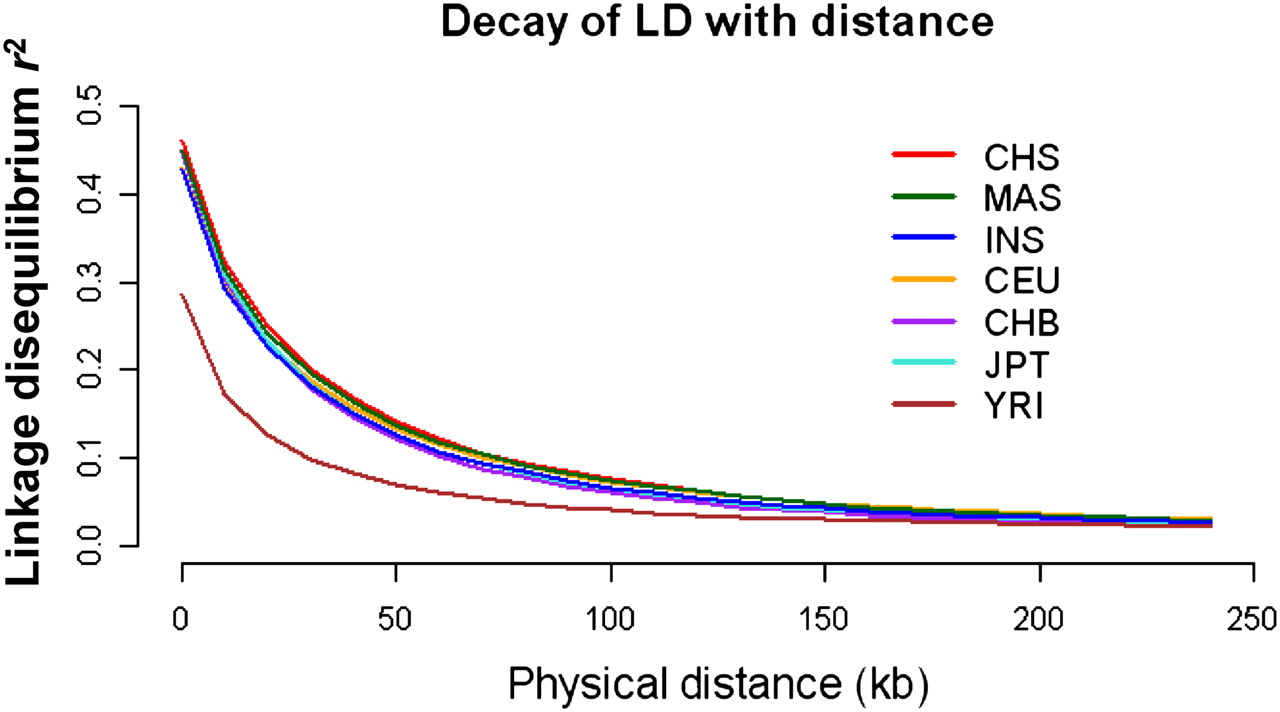
Figure 3.
Decay of LD with distance. Decay of LD as measured by the r2 statistic with increasing distance up to 250 kb for each of the HapMap and SGVP populations, where 90 chromosomes were chosen from each population to perform the LD calculation. Only SNPs with minor allele frequencies ≥5% in each population were considered in this analysis.


