
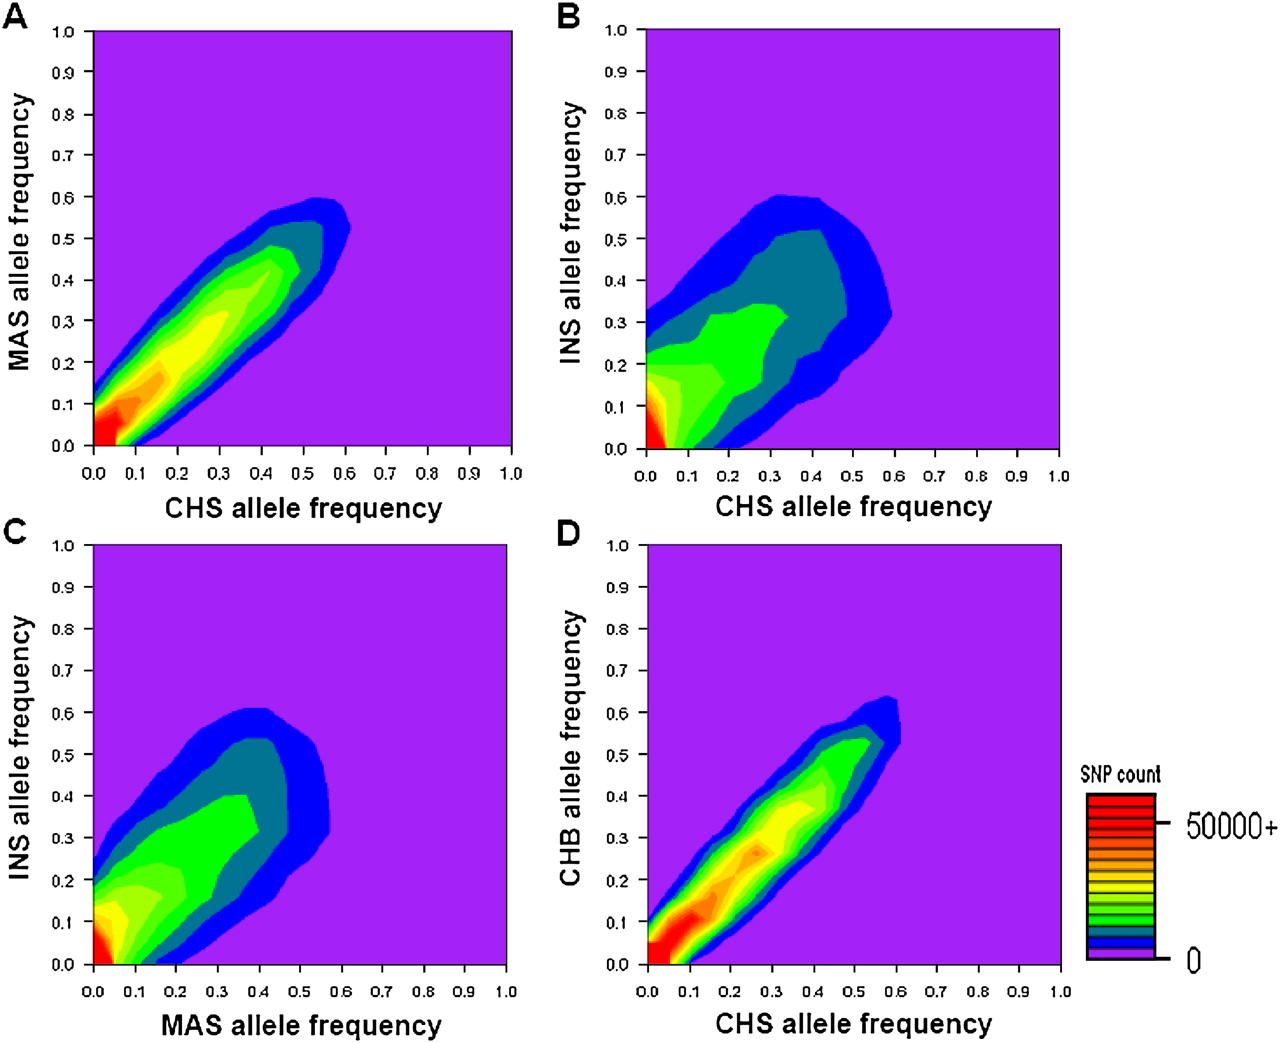
Allele frequency comparison between pairs of populations. The axes in each figure represent the allele frequencies for each of the two represented populations. For each SNP, we define the minor allele after agglomerating the genotype data from all three SGVP populations and subsequently calculate the frequency of this allele in each population. Twenty allele frequency bins each spanning 0.05 units are constructed for each population, and we tabulate the number of SNPs found in each bin. The intensity of the contour represents the number of SNPs that displayed the corresponding allele frequencies in the two populations, from a low number of SNPs (purple) to a higher number of SNPs (red). The figure panels compare the allelic spectrum among CHS-MAS (A), CHS-INS (B), MAS-INS (C), and CHS-CHB (D).


