
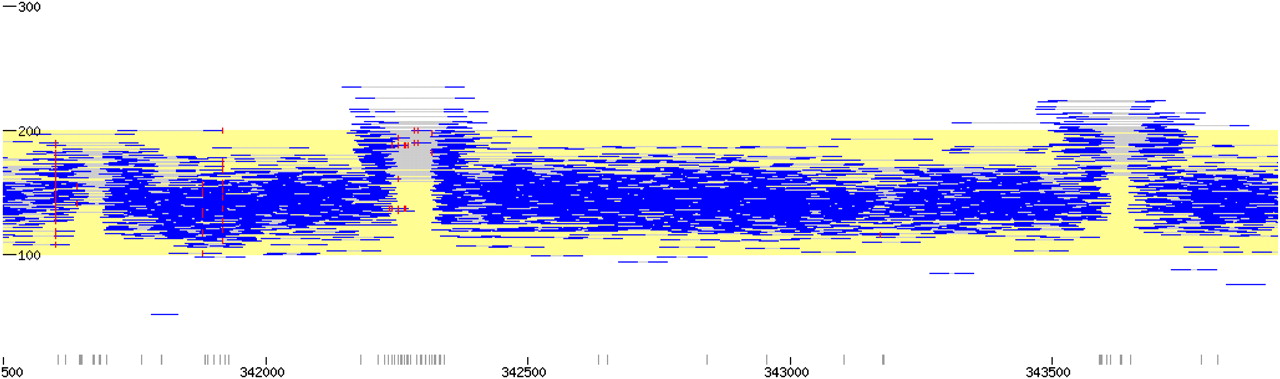
Figure 3.
Read pair view of an ∼2-kbp region. Chromosomal position on horizontal axis; pair alignment distance on vertical axis. Reads are in blue; read pairs are connected by gray lines. Expected fragment size is highlighted in yellow. Mismatches to the reference (possible SNPs) are marked in red.


