
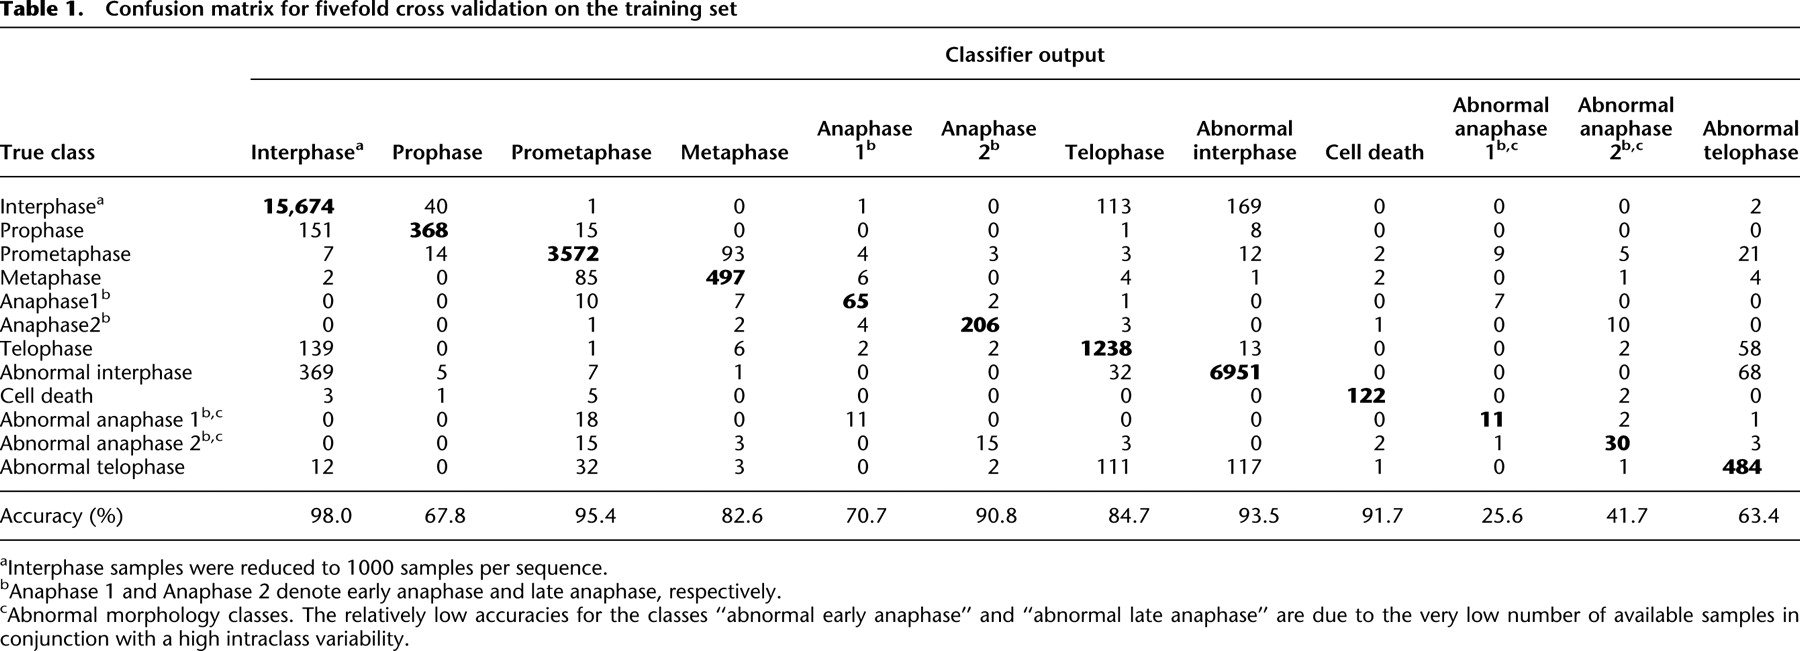
Table 1.
Confusion matrix for fivefold cross validation on the training set
Click on table to view larger version.
-
aInterphase samples were reduced to 1000 samples per sequence.
-
bAnaphase 1 and Anaphase 2 denote early anaphase and late anaphase, respectively.
-
cAbnormal morphology classes. The relatively low accuracies for the classes “abnormal early anaphase” and “abnormal late anaphase” are due to the very low number of available samples in conjunction with a high intraclass variability.


