
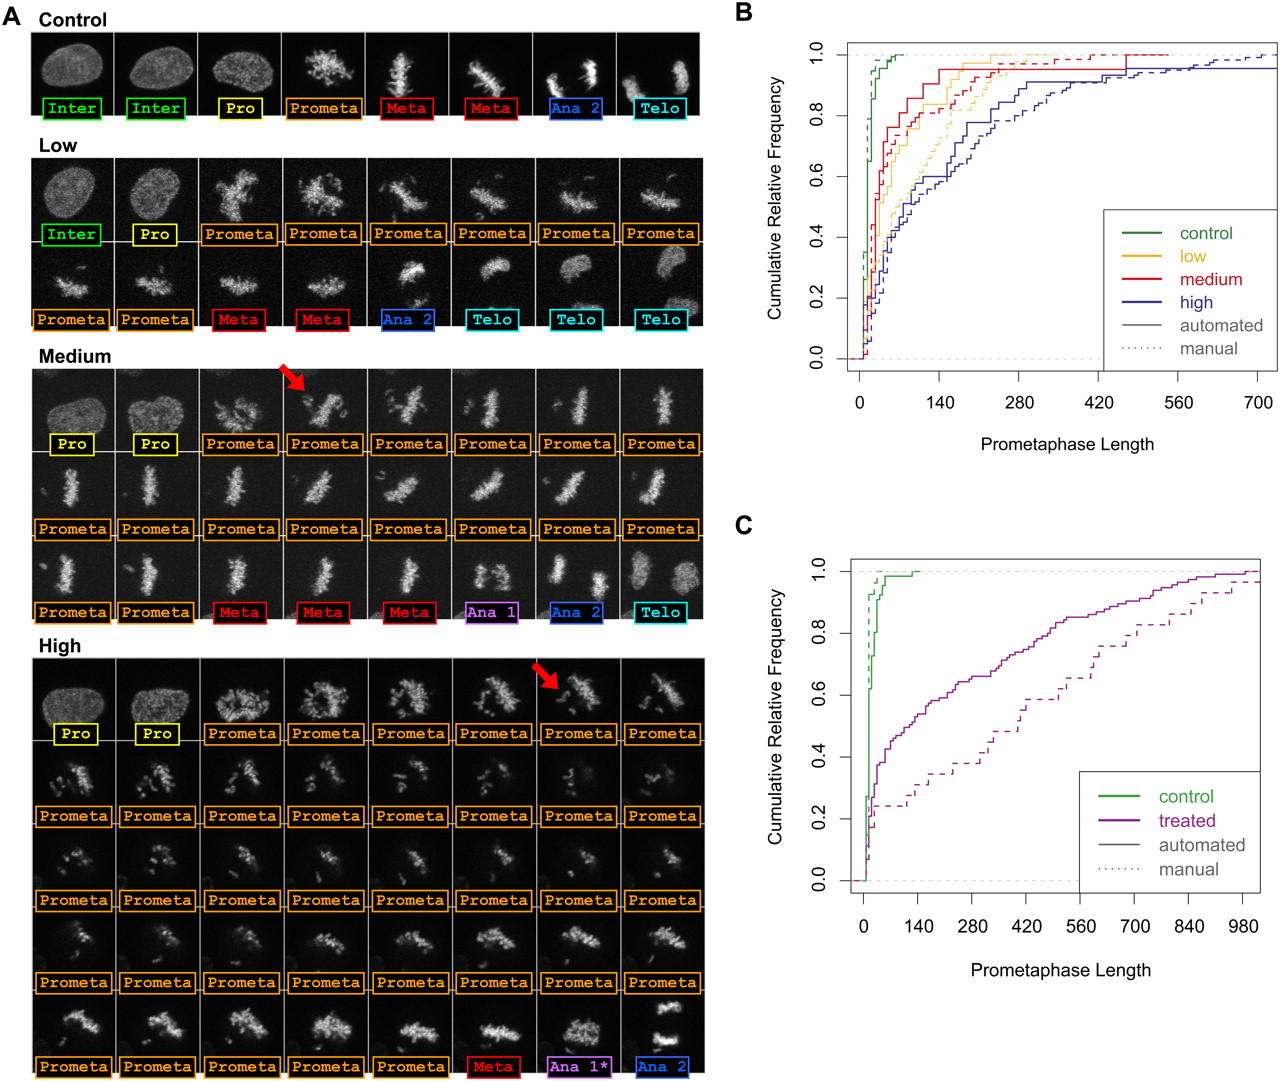
Prometaphase prolongation for different treatments. (A) Sample image sequences with the automatic annotation result for the three different nocodazole experiments (for the same images of the RNAi-depletion experiment, see Supplemental Fig. S5). The first occurrence of morphological aberrations is marked for each image sequence by a red arrow. (B) Cumulative histogram of prometaphase length for all concentrations of the automatically (manually) annotated nocodazole experiments. (C) Cumulative histogram for the automatically (manually) annotated scr control and CKAP5 RNAi experiments. (Solid lines) Automated annotation; (dashed lines) manual annotation. The prometaphase length is given in minutes.


