
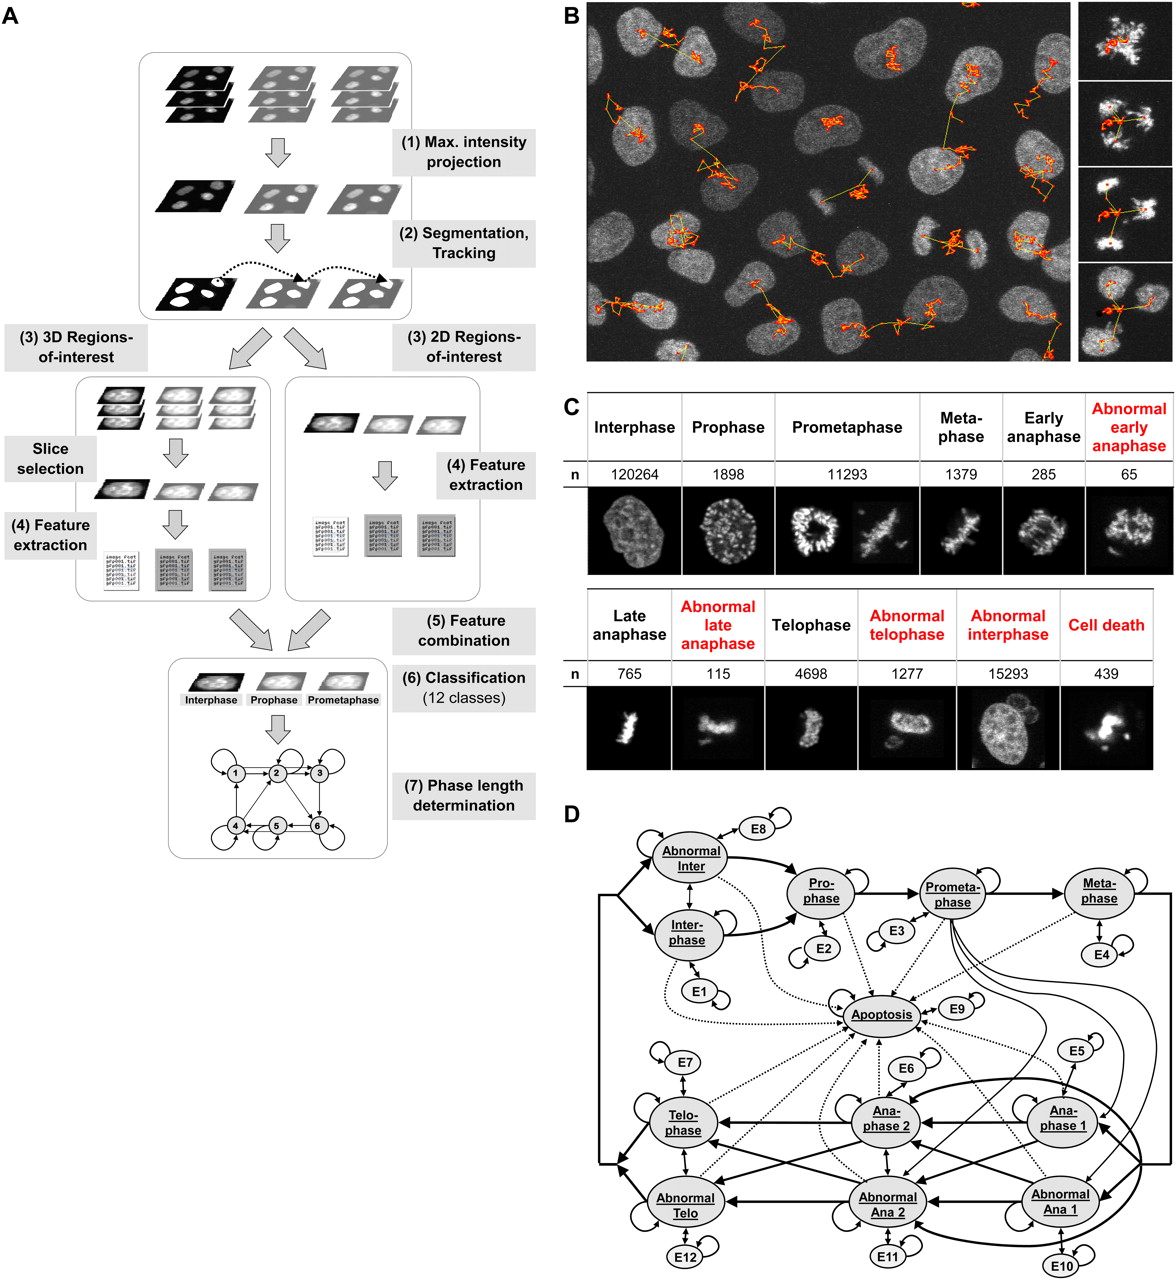
Phase length determination. (A) Image analysis workflow. Steps from top to bottom: (1) maximum intensity projection resulting in 2D image sequences, (2) segmentation and tracking, (3) determination of 2D regions-of-interest in the projected images and 3D regions-of-interest in the original 3D images, (4) computation of image features on the projected images for 2D regions-of-interest, computation of image features on the most informative slices for 3D regions-of-interest, (5) combination of both feature sets, (6) classification to determine the mitotic phases, (7) consistency check and phase length determination for resulting phase sequences. (B) Tracking result for several dividing cell nuclei (left) and for a nucleus that divides into three daughter nuclei (right). (C) Sample images to illustrate the considered 12 classes, including seven normal cell cycle phases (black), four morphological phenotype classes, and a cell death class (red). n is the total number of processed samples per class. (D) Finite state machine (FSM) to check and correct phase sequences. The phases are modeled by the states of the FSM, the possible phase transitions are represented by the state relations. If an illegal phase transition occurs, the FSM passes into the respective error state. For clarity not all relations of the error states E1–E12 are displayed.


