
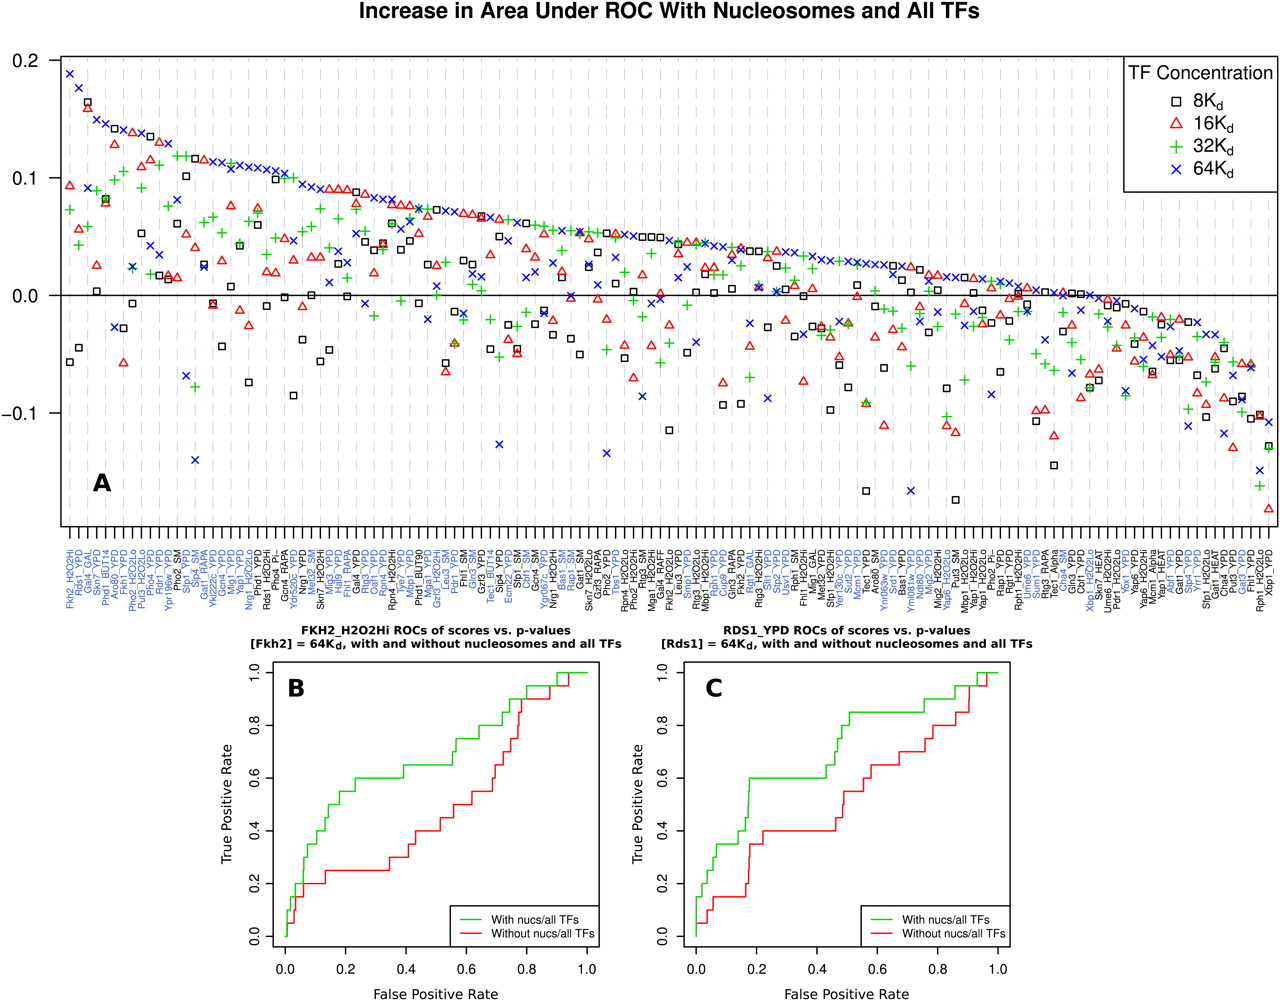
DBF competition improves transcription factor positioning predictions genome-wide. COMPETE is used to predict mean probabilities of TF binding in regions corresponding to probes from whole-genome ChIP-chip TF binding data (Harbison et al. 2004). The top and bottom 10% of regions as scored by COMPETE are respectively labeled as positively and negatively-bound promoters. ROCs are then constructed for probe P-values using these labels. The change in the area under the curve (AUC) of the ROCs is calculated between a model including only one TF and a model including that TF and nucleosomes and all other TFs, at various TF concentrations. The concentrations of all TFs are set to the same multiple of their respective Kd; the value of Kd for each TF is different and calculated from its PSSM, as in Granek and Clarke (2005). (A) Change in ROC AUC between TF-only and all TF and nucleosome models, across concentrations. Each point represents a pair of whole-genome analyses, with and without nucleosomes and all other TFs, totaling 272 decodings of the entire genome and 1080 individual analyses. Positive values signify improvement. Experimental conditions for each ChIP-chip experiment are given on the x-axis, with the best performing condition for each TF highlighted in blue. Most TF binding predictions either improve or behave somewhat similarly when including nucleosomes. As it is likely that different concentration choices are appropriate for each TF, several concentrations are included. Values of all points are given in Supplemental Table S1. (B) ROCs of Fkh2 ChIP-chip P-values with labels determined by binding probability as predicted by COMPETE in the FKH2_H2O2Hi experiment, with a model including Fkh2, nucleosomes, and all other TFs (green), and a model including Fkh2 alone (red). (C) Same as B, but using the RDS1_YPD experiment with models including Rds1 in place of Fkh2.


