
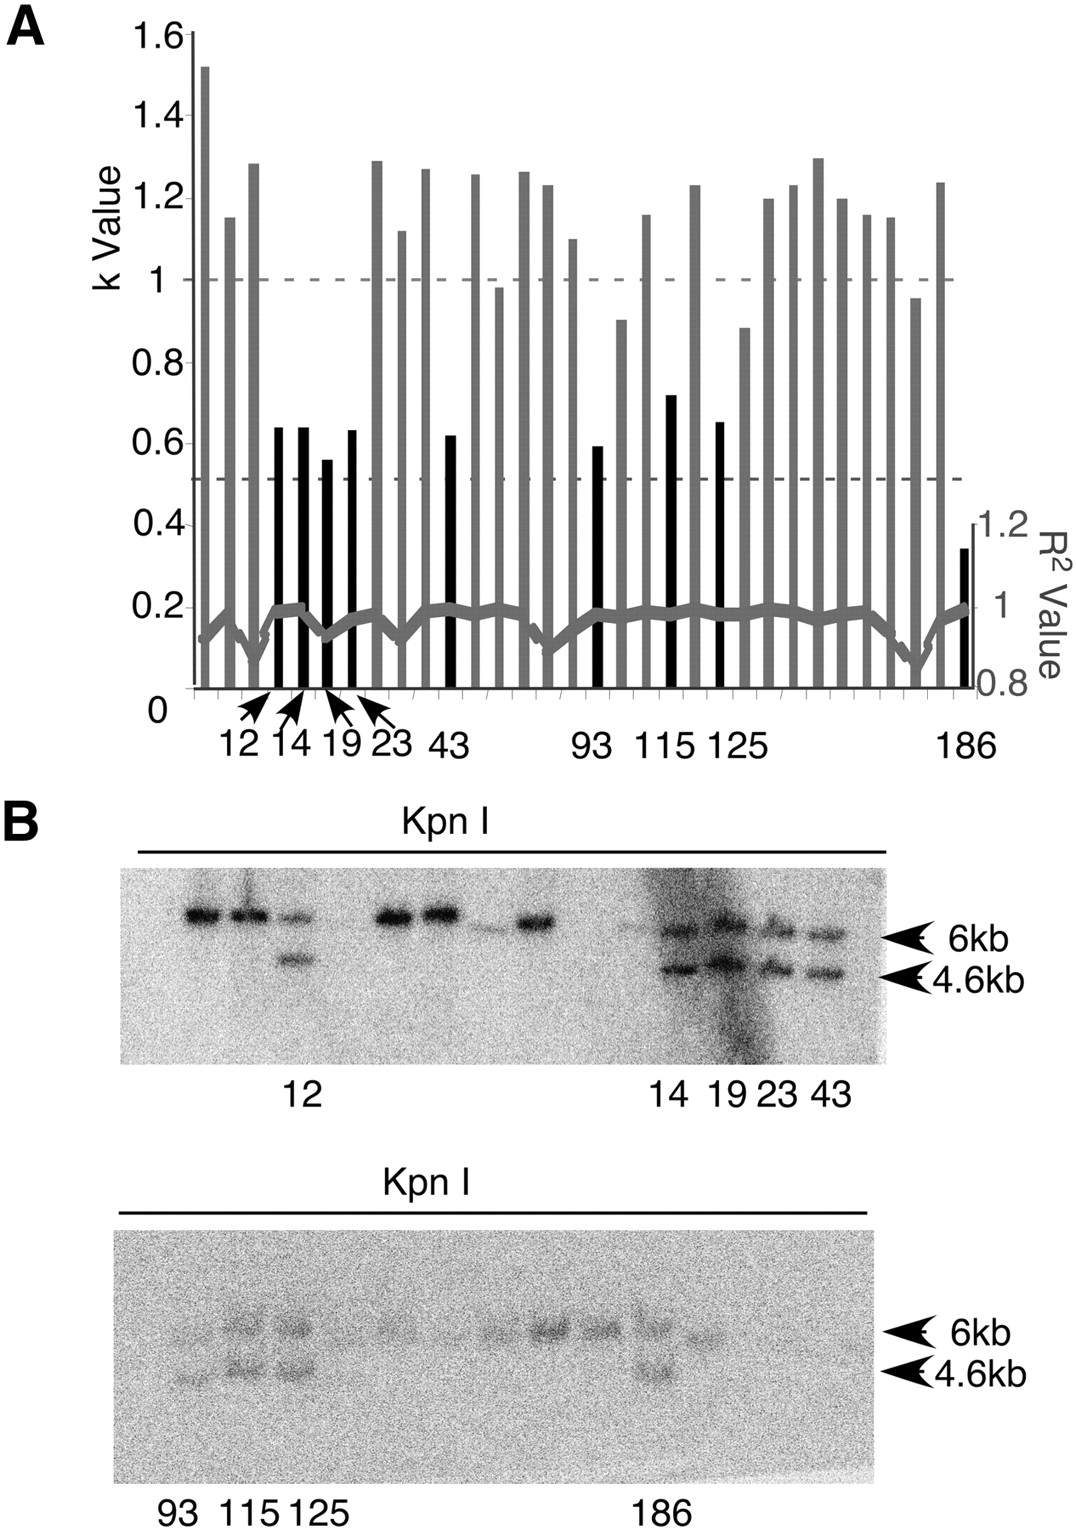
Figure 4.
Identifying HR clones in targeted ES cells using RQPS. (A) Refined screening of 32 ES cells falling within group A (Fig. 5B). Two different dilutions of RQPS probe were made for each ES cell genomic DNA sample and pyrosequenced. The black bar represents HR candidates (clone ID shown) with k-values indicating loss of one Notch1 allele. R2 values for a zero intercept line are also plotted. (B) All HR candidates identified in A were confirmed by Southern blot, each containing the WT allele fragment (6 kb) and the targeted allele fragment (4.6 kb) expected after KpnI digestion.


