
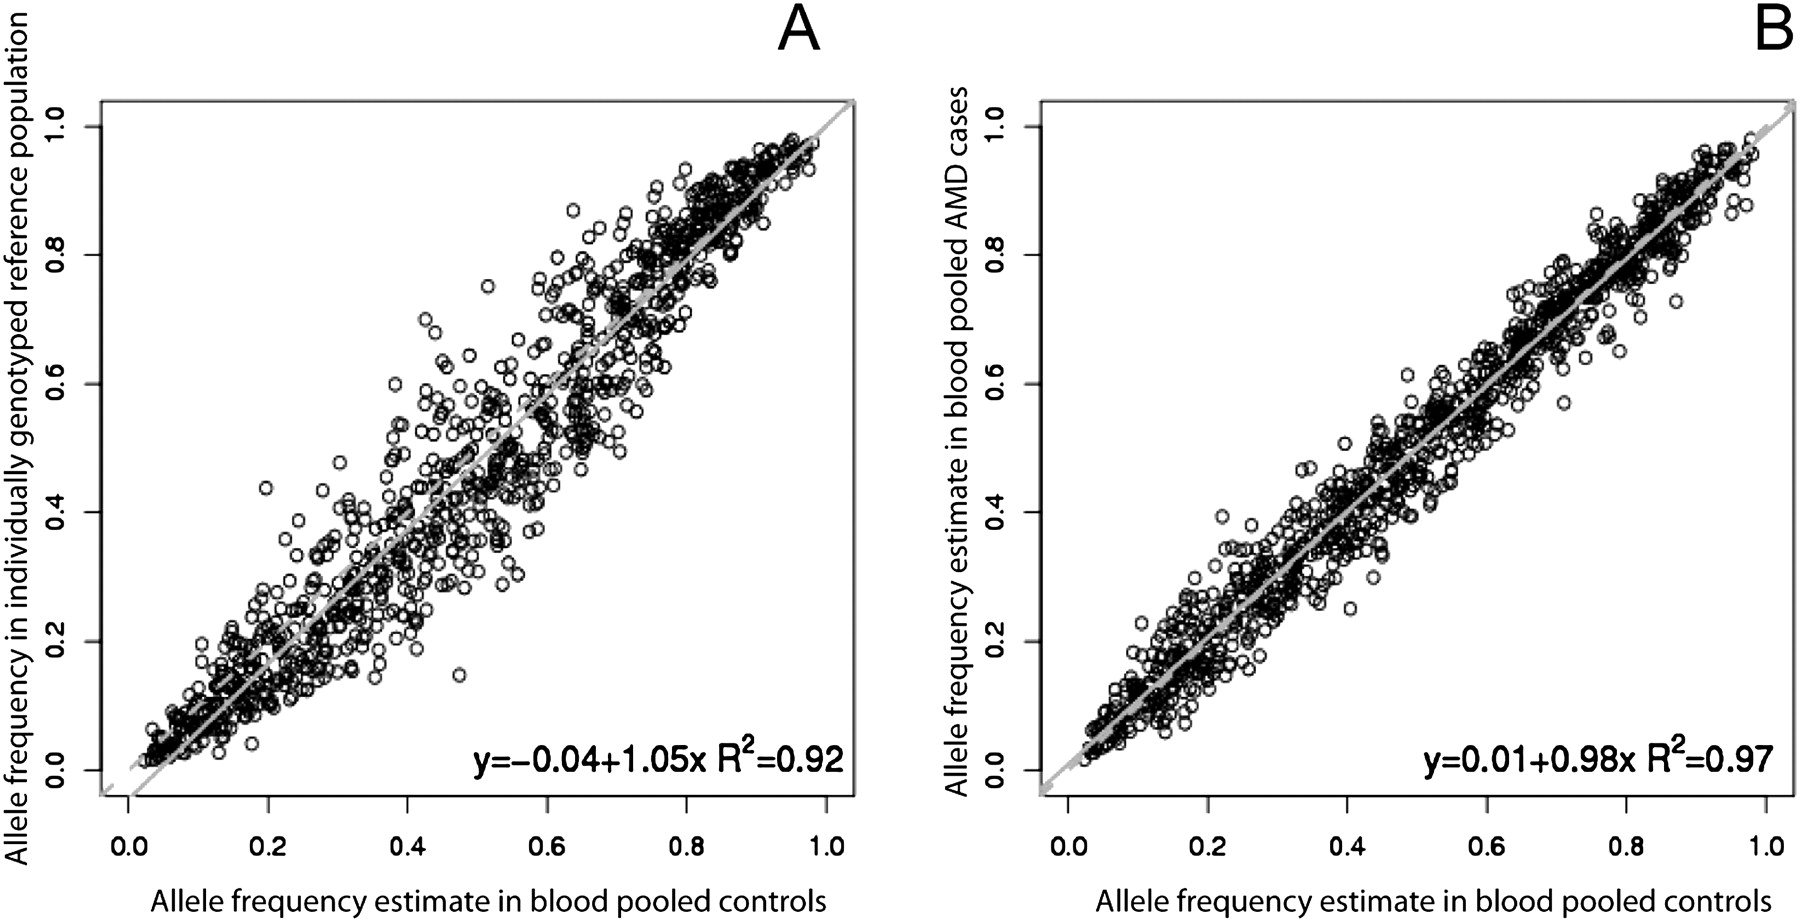
Figure 1.
(A) Comparison in allele frequency between 540 individually genotyped Caucasian reference samples compared to the 216 control POB samples. (B) Correlation between estimated allele frequencies in the POB AMD case and control subjects. (A,B) A subset of 1000 randomly chosen SNPs are plotted, with the broken gray line being y = x and the solid gray line the regression line for the full set of SNPs. The reduced correlation in A is due to the unequal amplification of alleles (see main text for discussion).


