
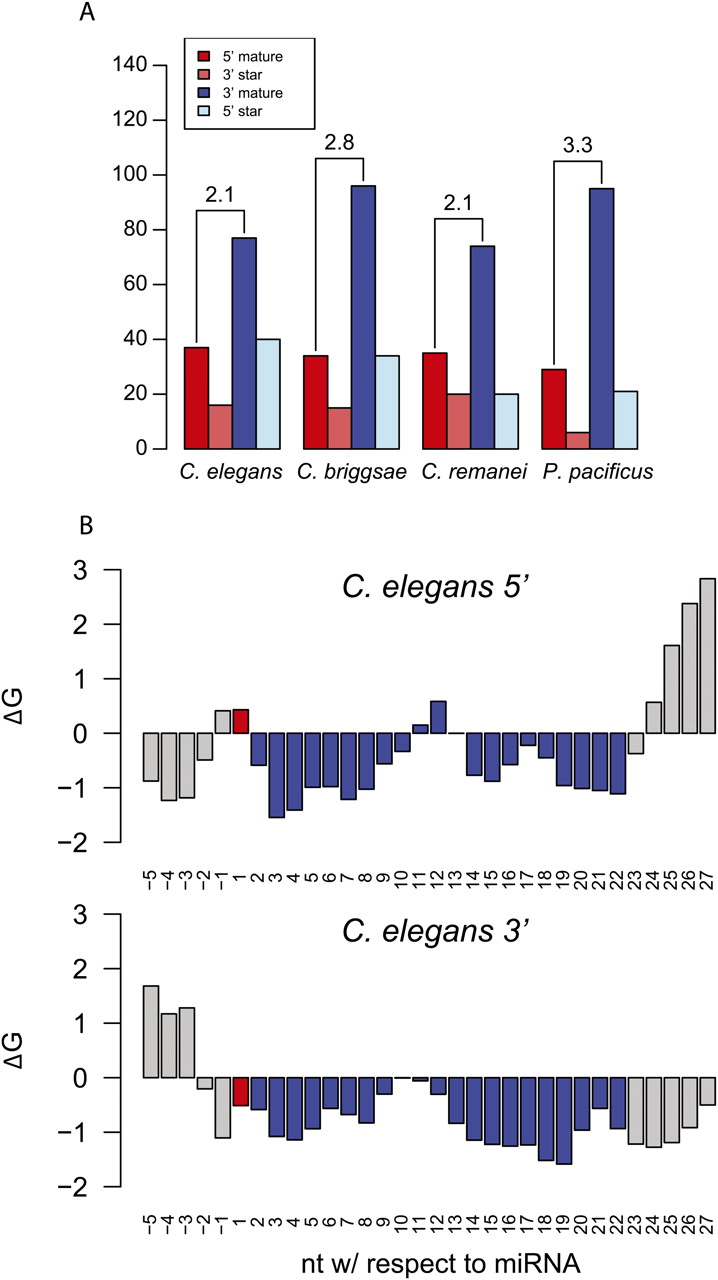
Arm bias and thermodynamic profiles. (A) Barplot showing the arm of origin for the mature and miRNA* sequences for all four species. Grouping of 5′ mature miRNA and 3′ miRNA* species and vice versa, reflects that they originate from the same precursor. Numbers above the bars indicate the fold enrichment of 3′ mature over 5′ mature. (B) Thermodynamic profiles for mature miRNAs originating from either the 3′ or 5′ arm. Secondary structures were calculated with mfold (Zuker 2003) and ΔG values extracted for single nucleotides. Positive ΔG values denote instability in the miRNA hairpin. The red bar identifies the starting nucleotide of the miRNA, the blue bars the rest of the canonical 22-nt miRNA.


