
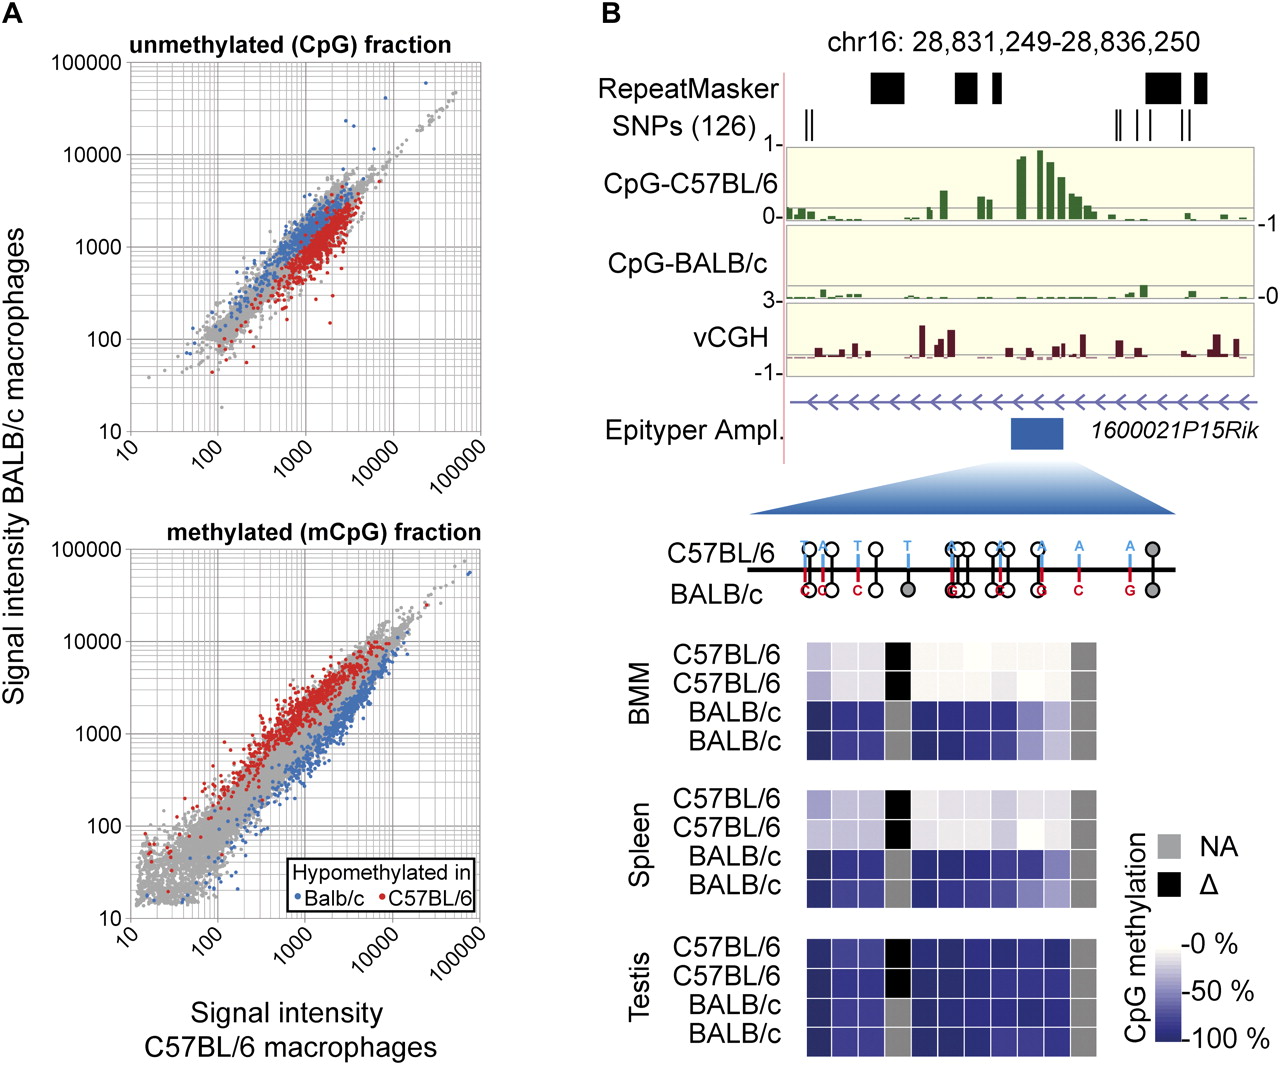
Validation of strain-specific CpG methylation by MALDI-TOF MS of bisulfite treated DNA. (A) Scatter plots of normalized signal intensities from independent hybridizations of methylated (mCpG) and unmethylated (CpG) DNA pools. Probes in differentially methylated regions (colored in red and blue) show the expected intensity distribution (enriched in one pool and depleted in the other one). (B) One example of a DMR detected by the MCIp-microarray approach and validation using MALDI-TOF MS of bisulfite treated DNA (three additional examples are presented in Supplemental Fig. S4). MCIp results are presented in the upper panels. Shown are the following tracks (from top to bottom) that were generated using the UCSC Genome Browser (http://genome.ucsc.edu/): repetitive regions as identified by the RepeatMasker program, single nucleotide polymorphisms from the dbSNP (NCBI database for genomic variation) build 126 (both in black), hypomethylation scores for BMM of both mouse strains (defined as the difference product of log10 signal intensity ratios of both hybridizations; in green), vCGH signals indicating the presence of genetic variation at probe level (in brown), as well as gene structures (in purple) and the position of amplicons (Epityper Ampl., in blue) that were designed for MALDI-TOF MS analysis of bisulfite treated DNA. The relative position of CpGs within amplicons is indicated below by small lollipops (with the upward orientation representing C57BL/6, and the downward orientation representing BALB/c). Sequence variations are highlighted in red and blue, black bars mark the position of exons, and gray lollipops are not analyzed by the MS. Methylation levels of individual CpGs in the indicated cell types (two individuals for each strain) are shown color-coded. The scale ranges from pale yellow (0% methylation) to dark blue (100% methylation), strain-specifically absent CpGs are colored black, nondetectable CpGs are marked in gray.


