
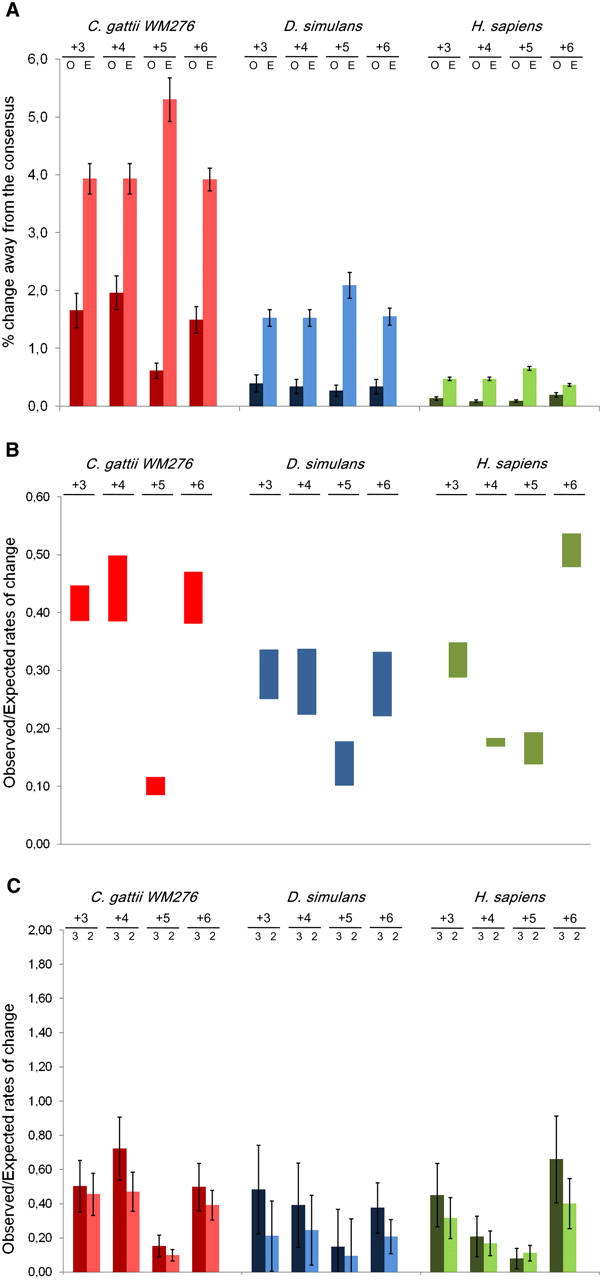
Consensus-to-variant changes for intron positions +3 through +6. (A) Observed (dark bars) and expected (light bars) degrees of change along external nucleotide branches are shown for three different species. (B) Range of sequence conservation across species within phylogenetic groups. The range of estimated Obs/Exp ratios for species within each group are given for each position (thus the top/bottom of the bar gives the estimate for the species with the highest/lowest corresponding estimated value within each species group). (C) Consensus-to-variant changes based on ancestral boundary strength. For each nucleotide site +3 through +6, Obs/Exp ratios for degree of change are given for boundaries with 4/4 (4) and 3/4 (3) ancestral consensus nucleotides. Error bars correspond to 95% confidence intervals for nucleotide change.


