
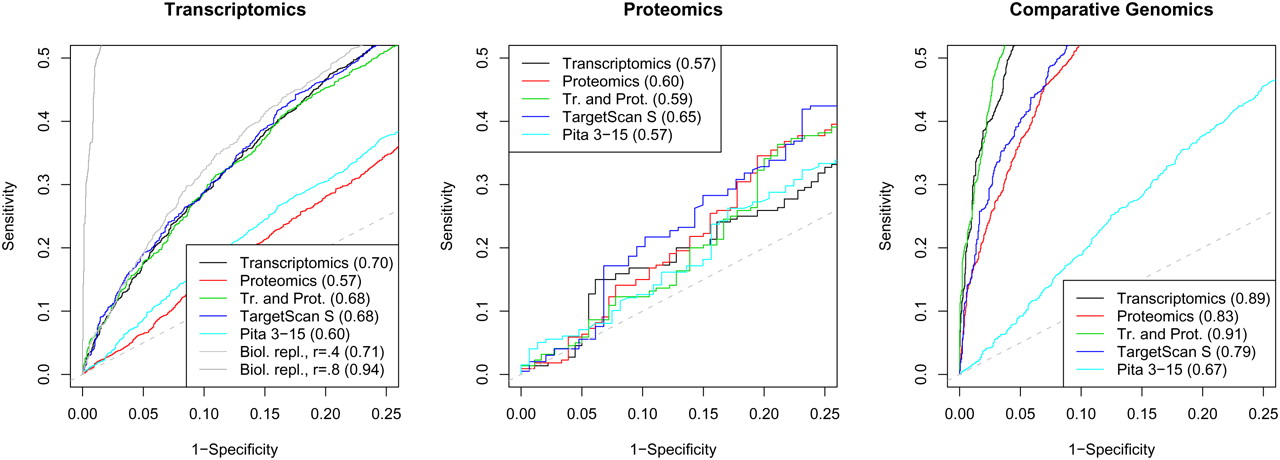
Receiver operating characteristic (ROC) curves of different miRNA target prediction algorithms on transcriptomics, proteomics, and comparative genomics data sets. The numbers that appear in parentheses in the legends indicate the areas under the curves (AUC). The model fitted on transcriptomics, proteomics, and combining the transcriptomics and comparative genomics data sets (Tr. and Prot.) include the following features: seed Eopen, target site Eopen, flanks G and U content, 3′ UTR length, ElMMo, seed Pinteraction, seed Eduplex, target site Eduplex, flanking sequence optimization, pos. 13–16 Eduplex, 3′ region Eduplex, distance to 3′ UTR boundary, and relative distance to 3′ UTR boundary. Pita 3–15 is the score according to the algorithm published by Kertesz et al. (2007), and TargetScan is the TargetScan S score from Grimson et al. (2007).


