
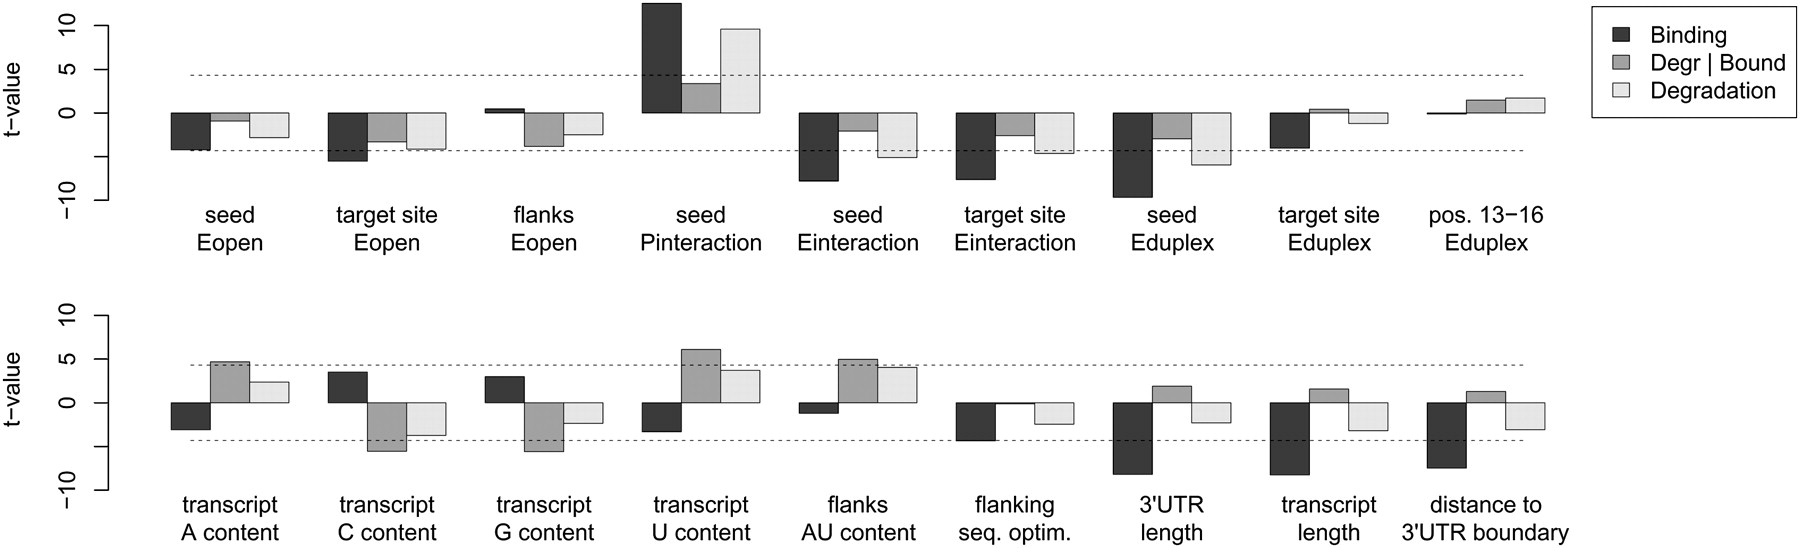
Contribution of secondary structure (upper panel), sequence, and transcript length-related (lower panel) features to the efficiency of EIF2C2 binding and mRNA degradation. The y-axis shows the value of the t-statistic obtained in comparing bound with unbound transcripts (dark gray bars), bound and degraded with bound, but not degraded transcripts (medium gray bars), and degraded with not degraded transcripts (light gray bars). The dashed lines indicate the values beyond which the difference in the mean values obtained for the positive and negative sets is considered significant with a bilateral type I error of 5% after applying the Bonferroni multiple testing correction. The individual features that we tested are indicated and further described in the text.


