
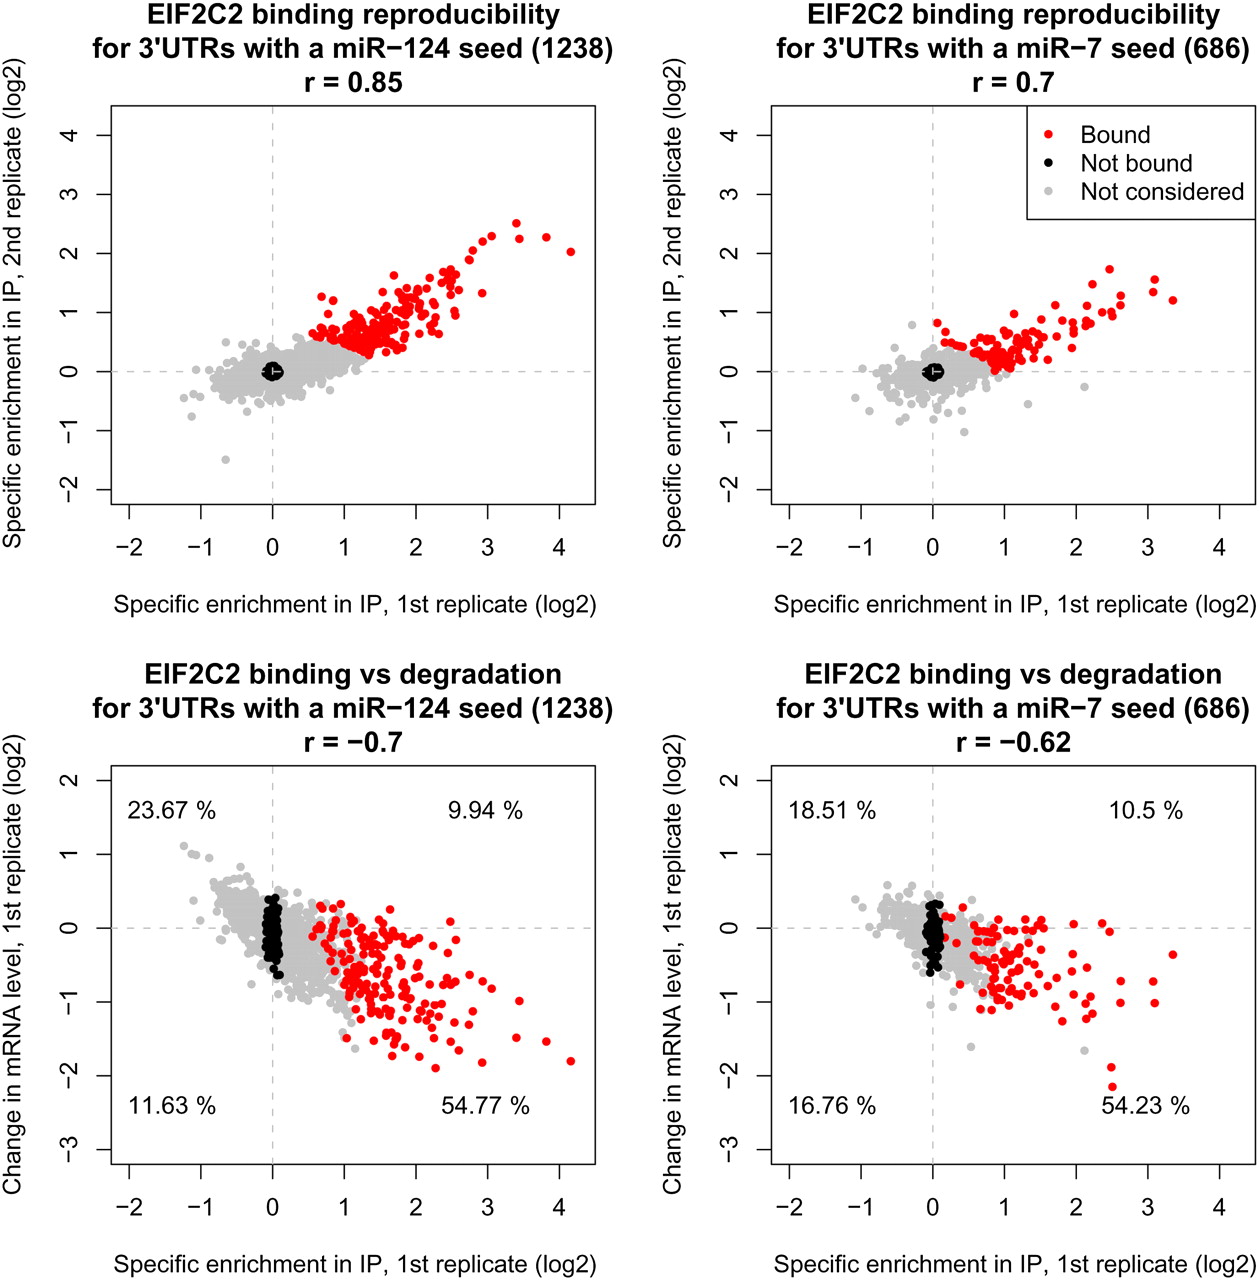
(Upper panels) Correlation between the level of EIF2C2 binding in two replicate experiments of transcripts carrying a single seed match for miR-124 (left) and miR-7 (right) in their 3′ UTRs. The level of EIF2C2 binding was computed as described in the Methods section. The number of transcripts and Pearson correlation coefficients are shown on the respective panels. Transcripts that were considered positives for EIF2C2 binding are marked with red, those that were considered negatives with black, and transcripts that were not used for feature analysis are shown in gray. (Lower panels) Correlation between EIF2C2 binding and mRNA degradation in one of the experiments (miR-124 overexpression in the left panel, miR-7 overexpression in the right panel). The levels of EIF2C2 binding and mRNA degradation were computed as described in the Methods section. The numbers in the four quadrants indicate the proportion of all transcripts with a single seed-complementary 3′ UTR site that fall in each individual quadrant.


