
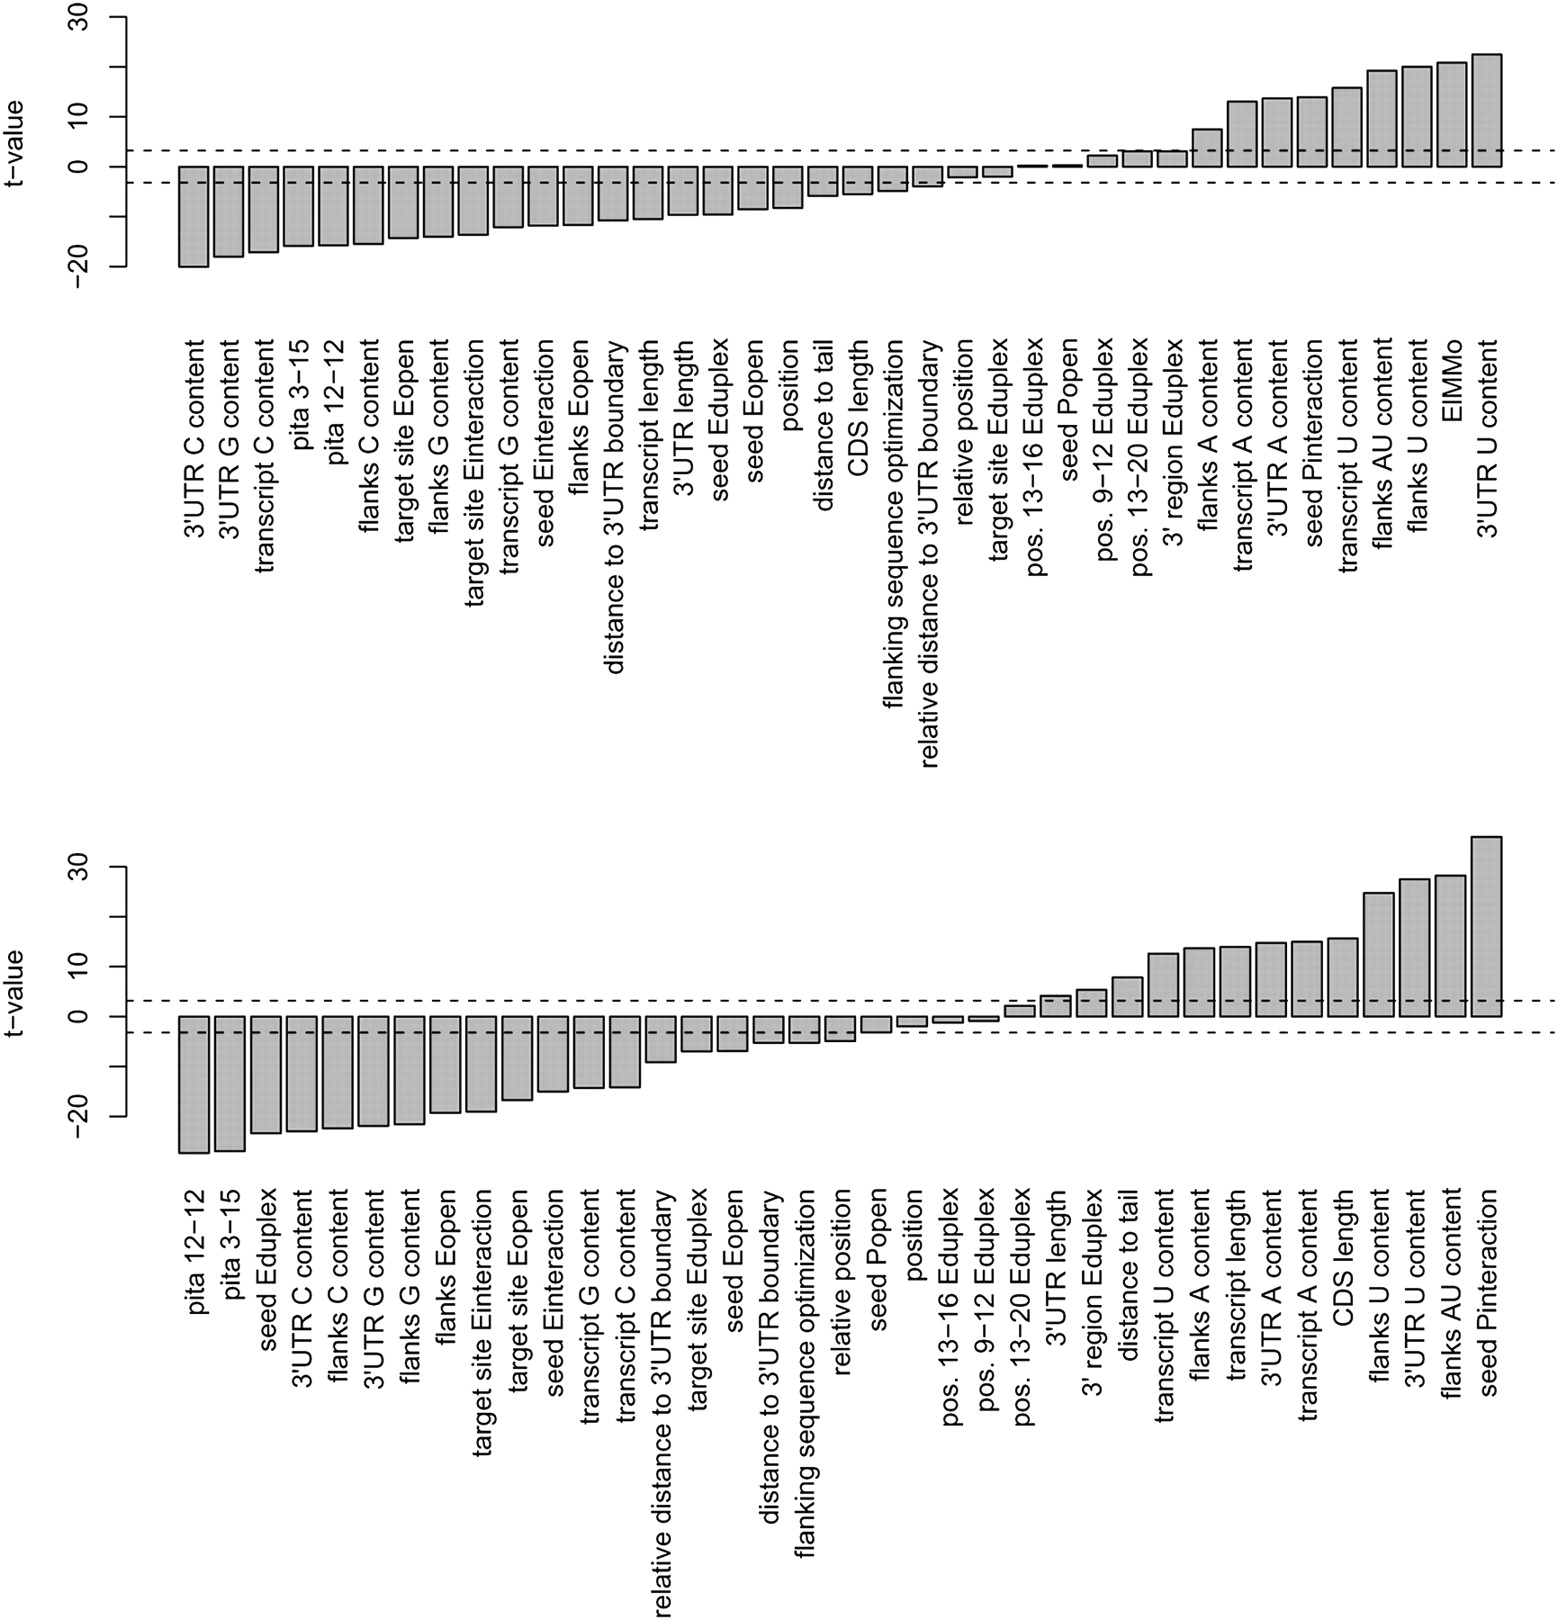
(Upper panel) Predictive power of different features across all transcriptomics experiments, excluding the let-7 and miR-30a transfections. (Lower panel) Predictive power of different features across all comparative genomic data sets. The y-axes show the t-values of the individual features when comparing their distribution in functional vs nonfunctional sites, aggregating over all data sets. The dotted horizontal lines represent the cutoff, where the t-values are significant with a bilateral type I error of 5% after applying the Bonferroni multiple testing correction. Pita 12–12 and Pita 3–15 are the scores according to the algorithm described in Kertesz et al. (2007), using 12–12 or 3–15 nt upstream and downstream of the miRNA target site for computing target site accessibility.


