
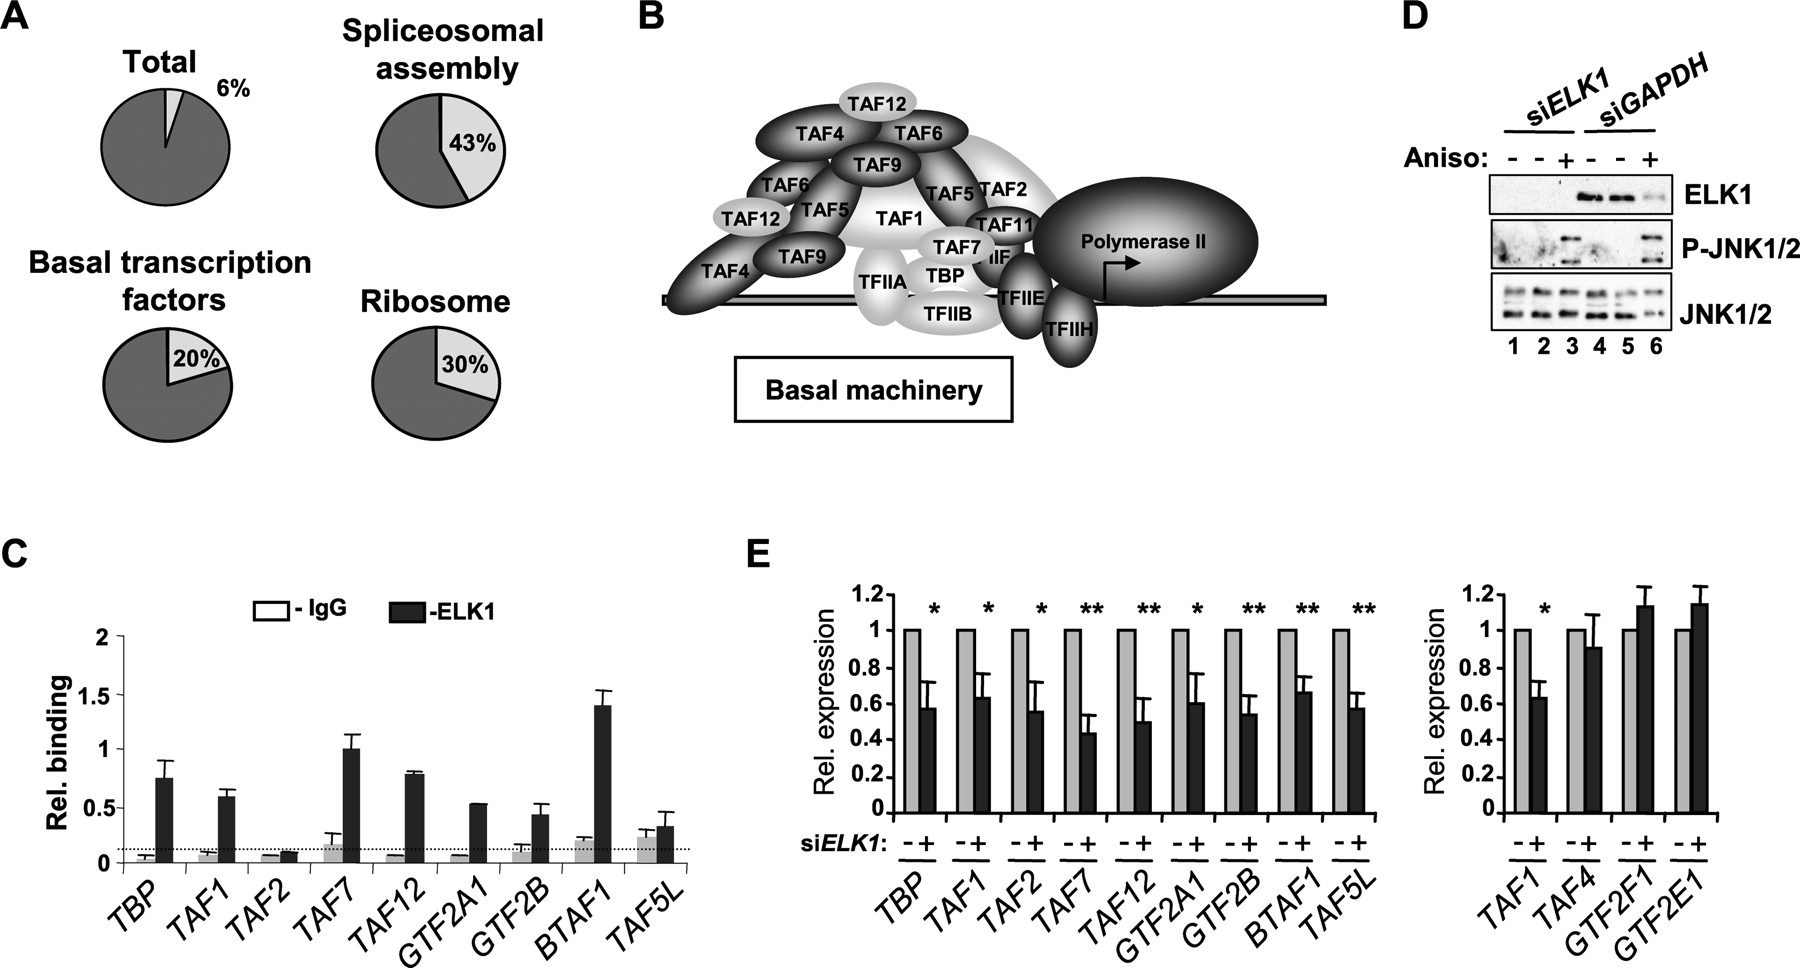
Coordinate regulation of a subset of general transcription factors by ELK1. (A) Pie charts illustrating the frequency of occurrence of ELK1-binding events (light-shaded segment) in the total number of genes (represented by annotated gene symbols) on the promoter array (total), or in pathways identified by KEGG (“basal transcription factors” and “ribosome”) or BioCarta (“spliceosomal assembly”) pathway analysis. (B) Subunits of the basal transcription machinery are shaded, with shading representing subunits whose promoters are bound (light) or not bound (dark) by ELK1. (C) qPCR-ChIP verification of ELK1 binding to promoters of the indicated genes. The dotted line represents average binding across all IgG control precipitations. Data are representative of two independent experiments and the average of triplicate samples. (E) RT-PCR analysis of expression of the indicated genes following treatment with anisomycin for 60 min in HeLa cells in the presence and absence of control (GAPDH) (gray bars) or ELK1-specific (black bars) siRNA duplexes. A Western blot showing the expression of ELK1 and the levels of active JNK (P-JNK1/2) in each sample is shown in D. Error bars represent standard deviations calculated from three biologically independent replicates and the average of two samples. Asterisks denote differences with statistical significances (*P < 0.05; **P < 0.01) relative to the control sample for each gene (siGAPDH), as determined by the Students t-test.


