
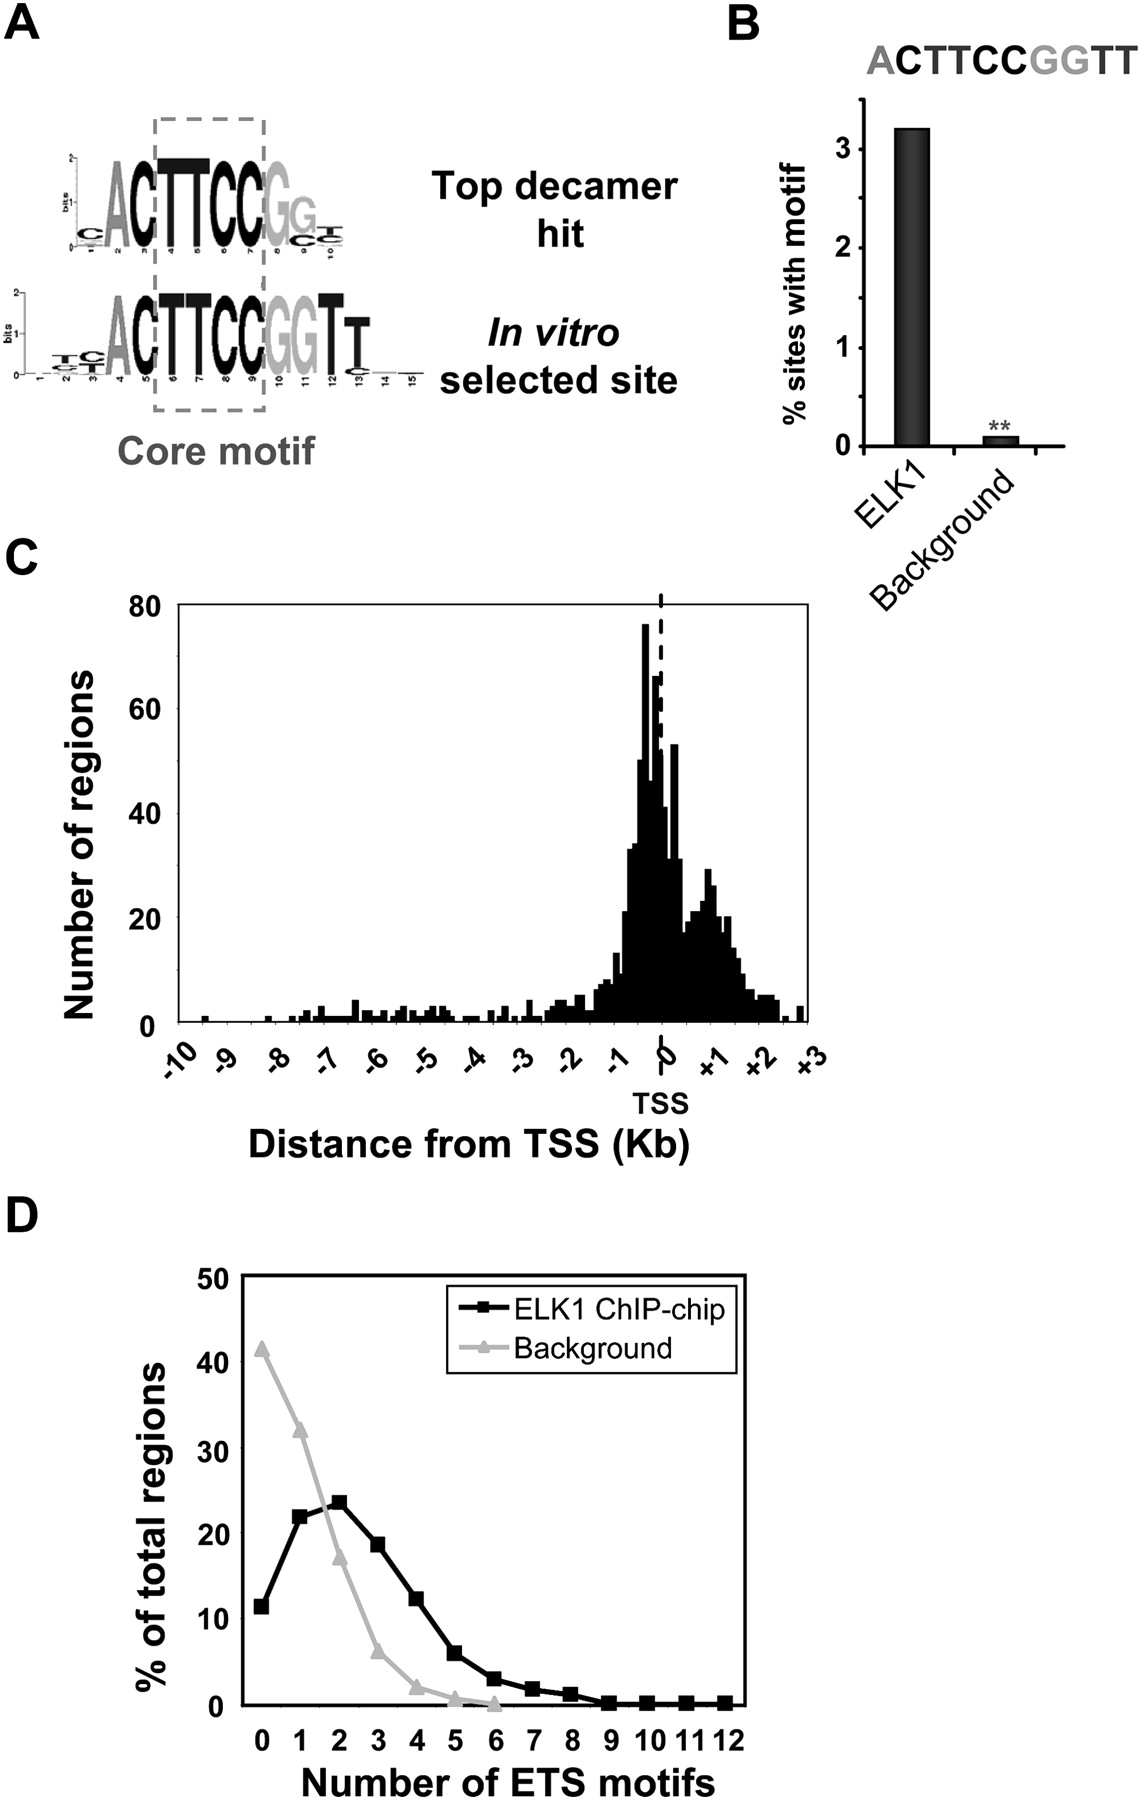
Features of the ELK1-binding regions. (A) Sequence logo representation of the top 10-bp sequence identified by de novo searching the ELK1 FDR < 10 data set for over-represented motifs. The sequence of the optimum in vitro-selected ELK1-binding site (Shore and Sharrocks 1995) is shown and the inverted core GGAA “ETS binding motif” is boxed. (B) Over-representation of the optimal 10-bp ELK1-binding motif in the ELK1 FDR < 10 data set in comparison to a background data set. **P ≤ 1 × 10⁻⁴. (C) Location of the most significant probe of the ELK1-binding regions with respect to the closest transcriptional start site (TSS). The distances corresponding to each of the regions were grouped into bin sizes of 100 bp for quantification. (D) The number of nonredundant occurrences of the hexameric motifs CCGGAA, CGGAAG, and GGAAGT in each binding region in the ELK1 FDR < 10 (black lines) and background datasets (gray lines) was determined, and the distribution of the frequency of occurrence of numbers of motifs in each data set plotted.


