
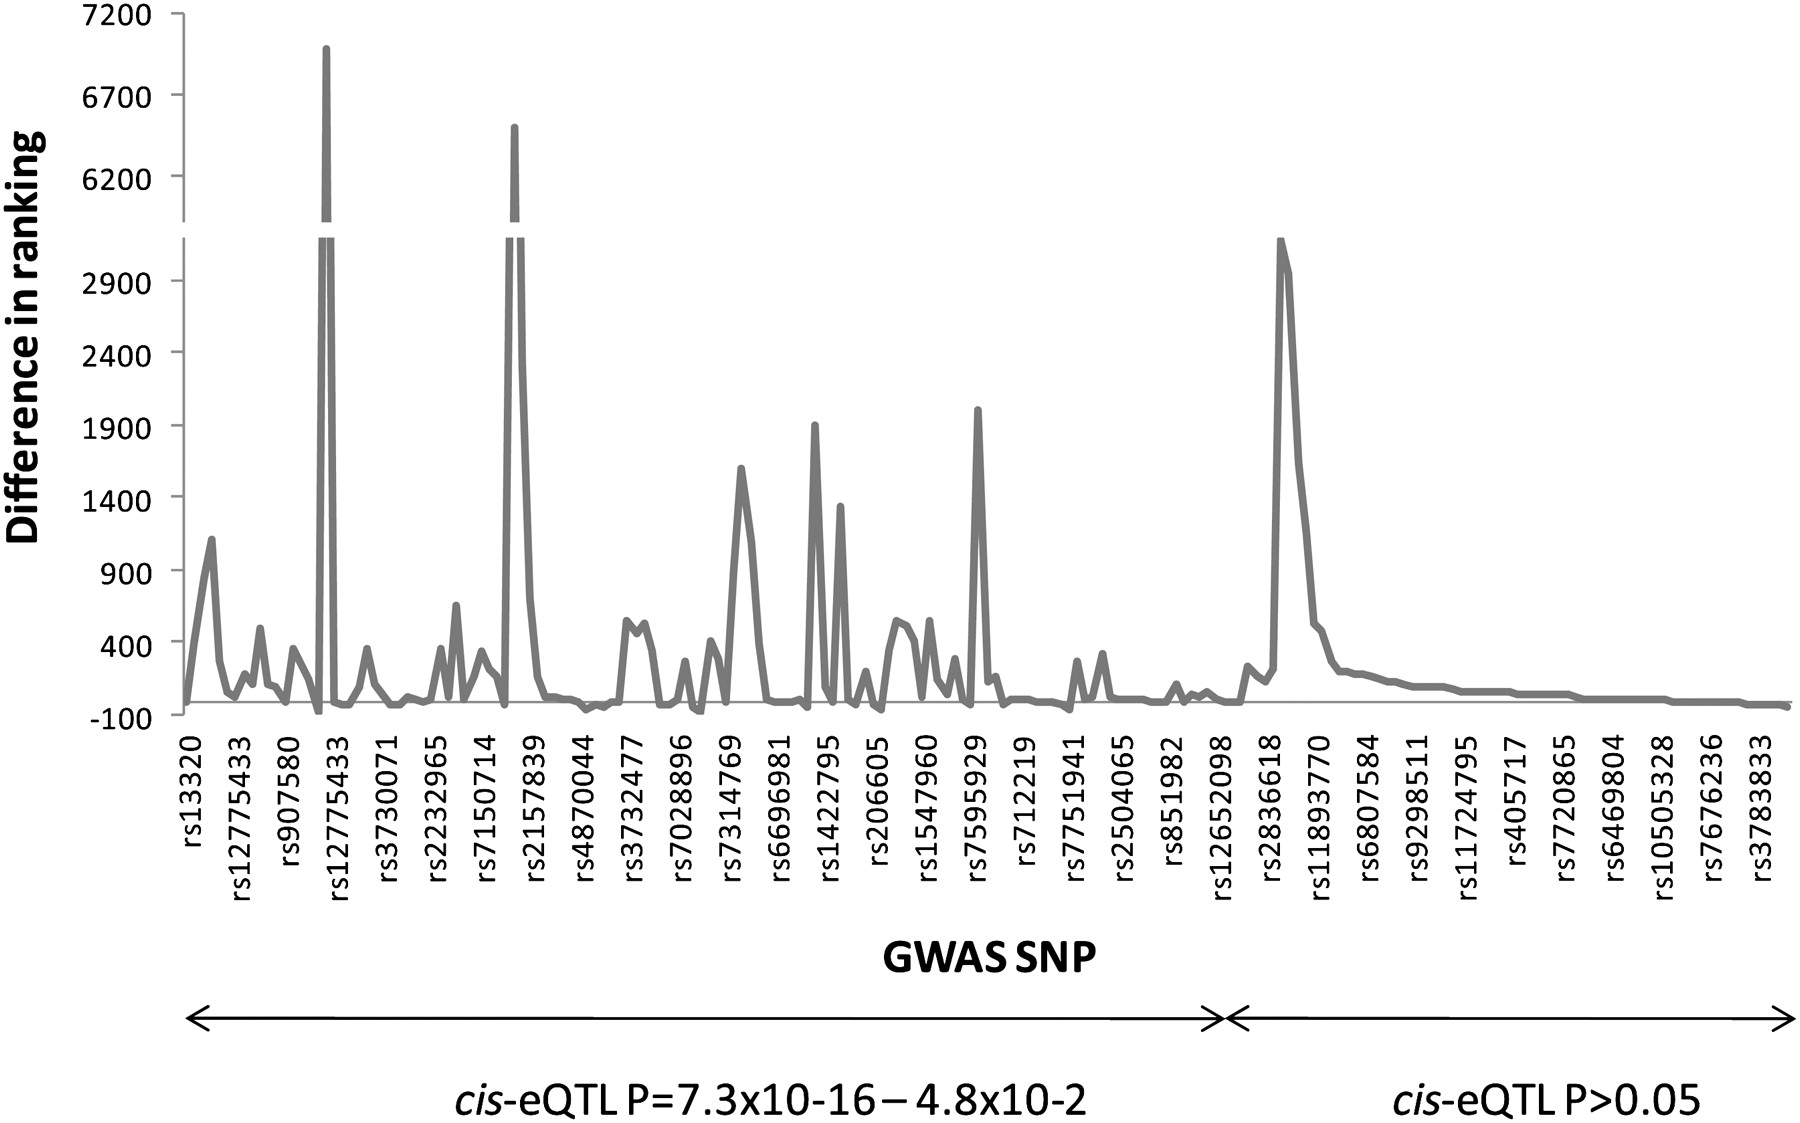
Figure 3.
Difference in ranking of BMD GWAS SNP following sample size increase. The top ∼200 ranked SNPs that were identified in an extended GWAS (from 6865 to 8510 Icelandic subjects) of BMD were functionally validated using HOb cis-eQTLs. The rank order differences, i.e., ranking in original GWAS-ranking in extended GWAS, (y-axis) of each SNP (x-axis) are connected with a line. SNPs are sorted based on cis-eQTL P-value where the SNPs with the smallest values are presented to the left and vice versa. The specific rs-number of every 7th SNP is presented on the x-axis but the line chart includes data points from all 200 SNPs.


