
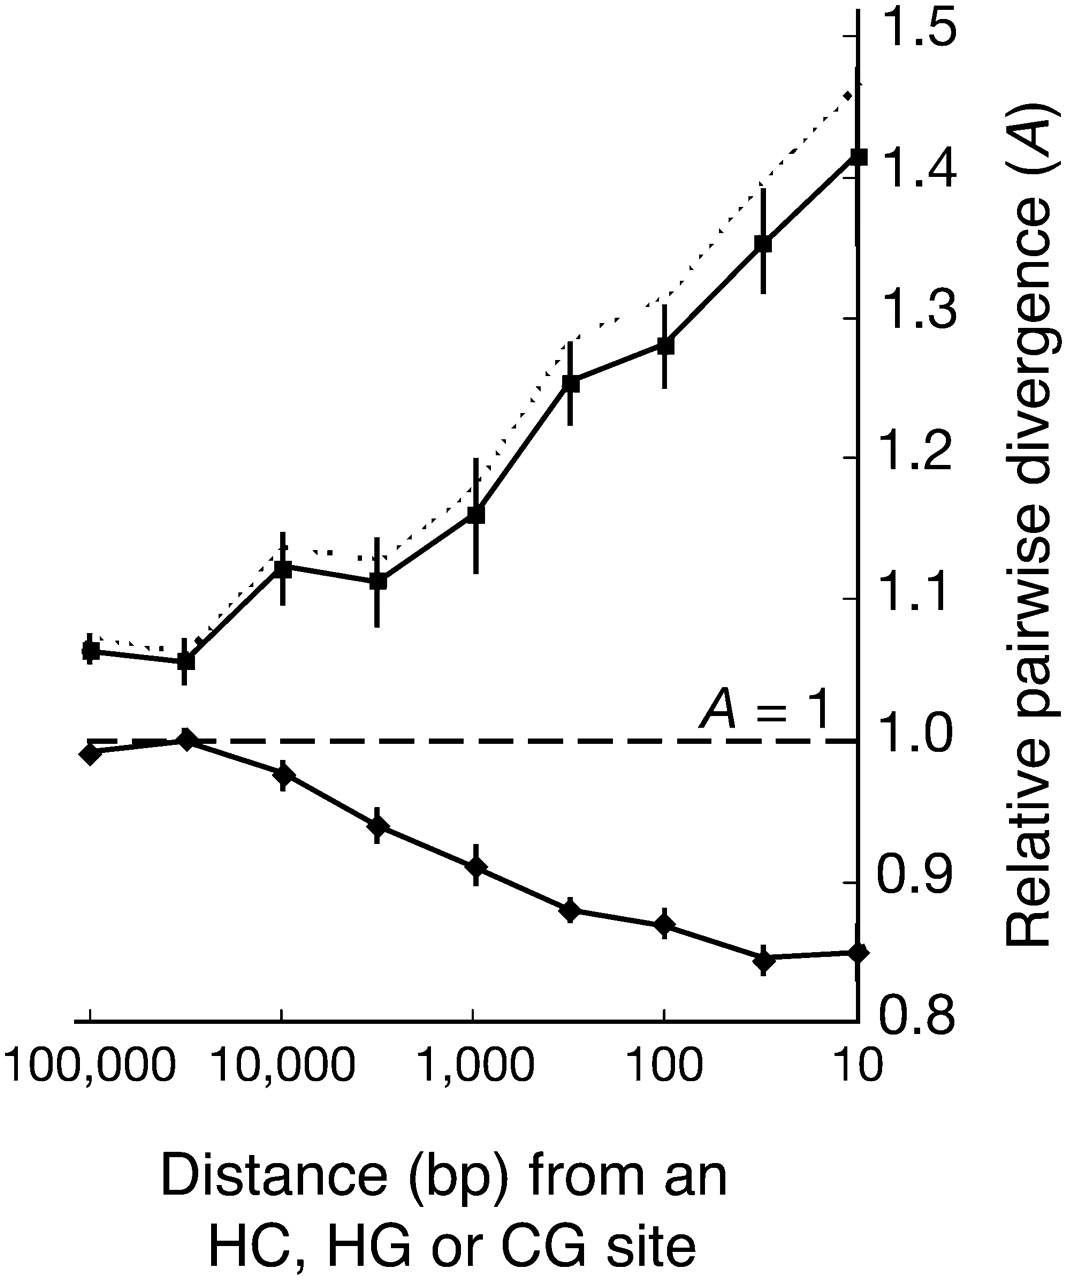
Figure 6.
Average human–chimpanzee divergence near an HC site (upper solid line) and near an HG or CG site (lower solid line) as a function of distance, based on the five-way (HCGOM) alignments of Patterson et al. (2006). Distances are measured as fractions of the genome-wide average (represented by A = 1). The dotted line reflects a correction for recurrent mutations. (Adapted with permission from Macmillan Publishers Ltd. © 2006, Patterson et al. 2006.)


