
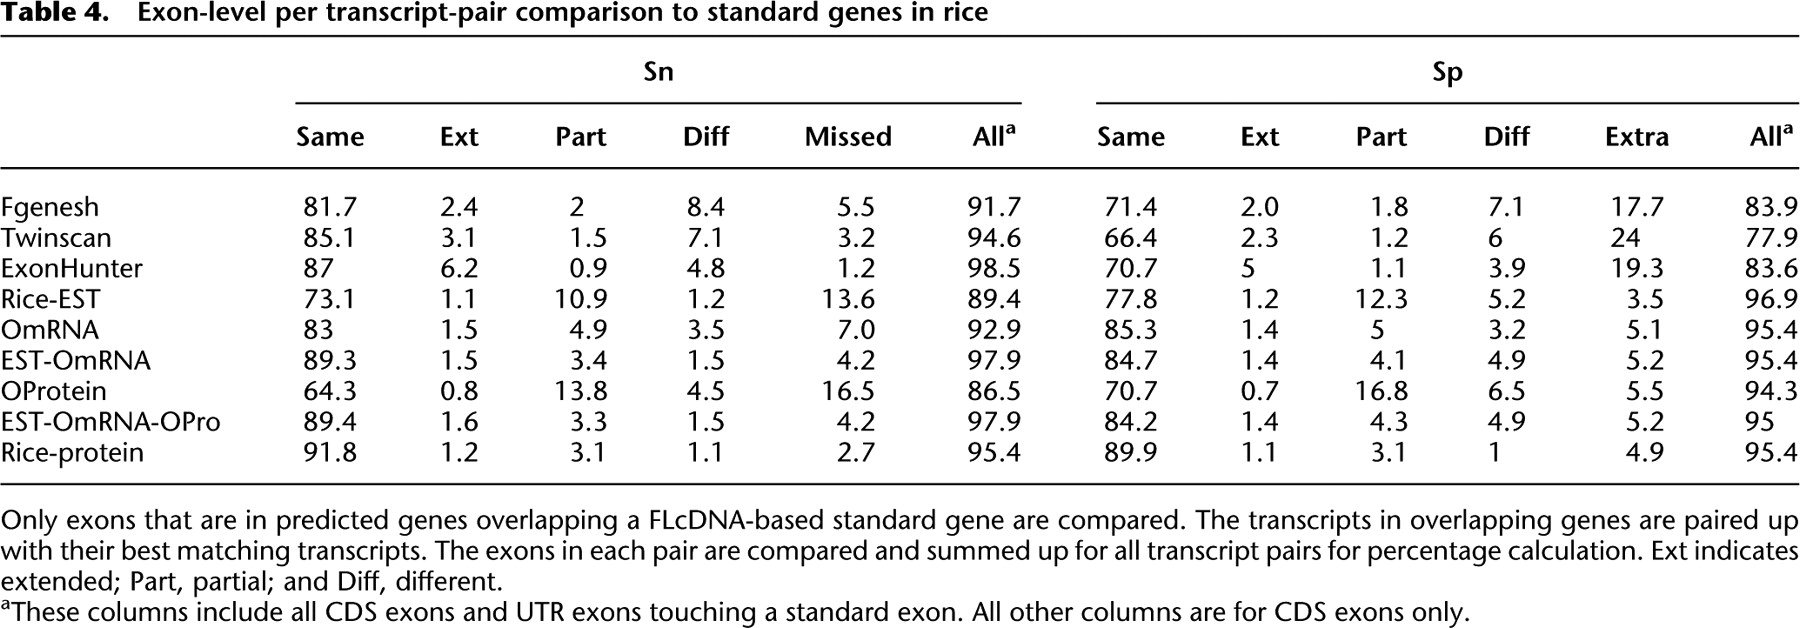
Table 4.
Exon-level per transcript-pair comparison to standard genes in rice
Click on table to view larger version.
-
Only exons that are in predicted genes overlapping a FLcDNA-based standard gene are compared. The transcripts in overlapping genes are paired up with their best matching transcripts. The exons in each pair are compared and summed up for all transcript pairs for percentage calculation. Ext indicates extended; Part, partial; and Diff, different.
-
aThese columns include all CDS exons and UTR exons touching a standard exon. All other columns are for CDS exons only.


