
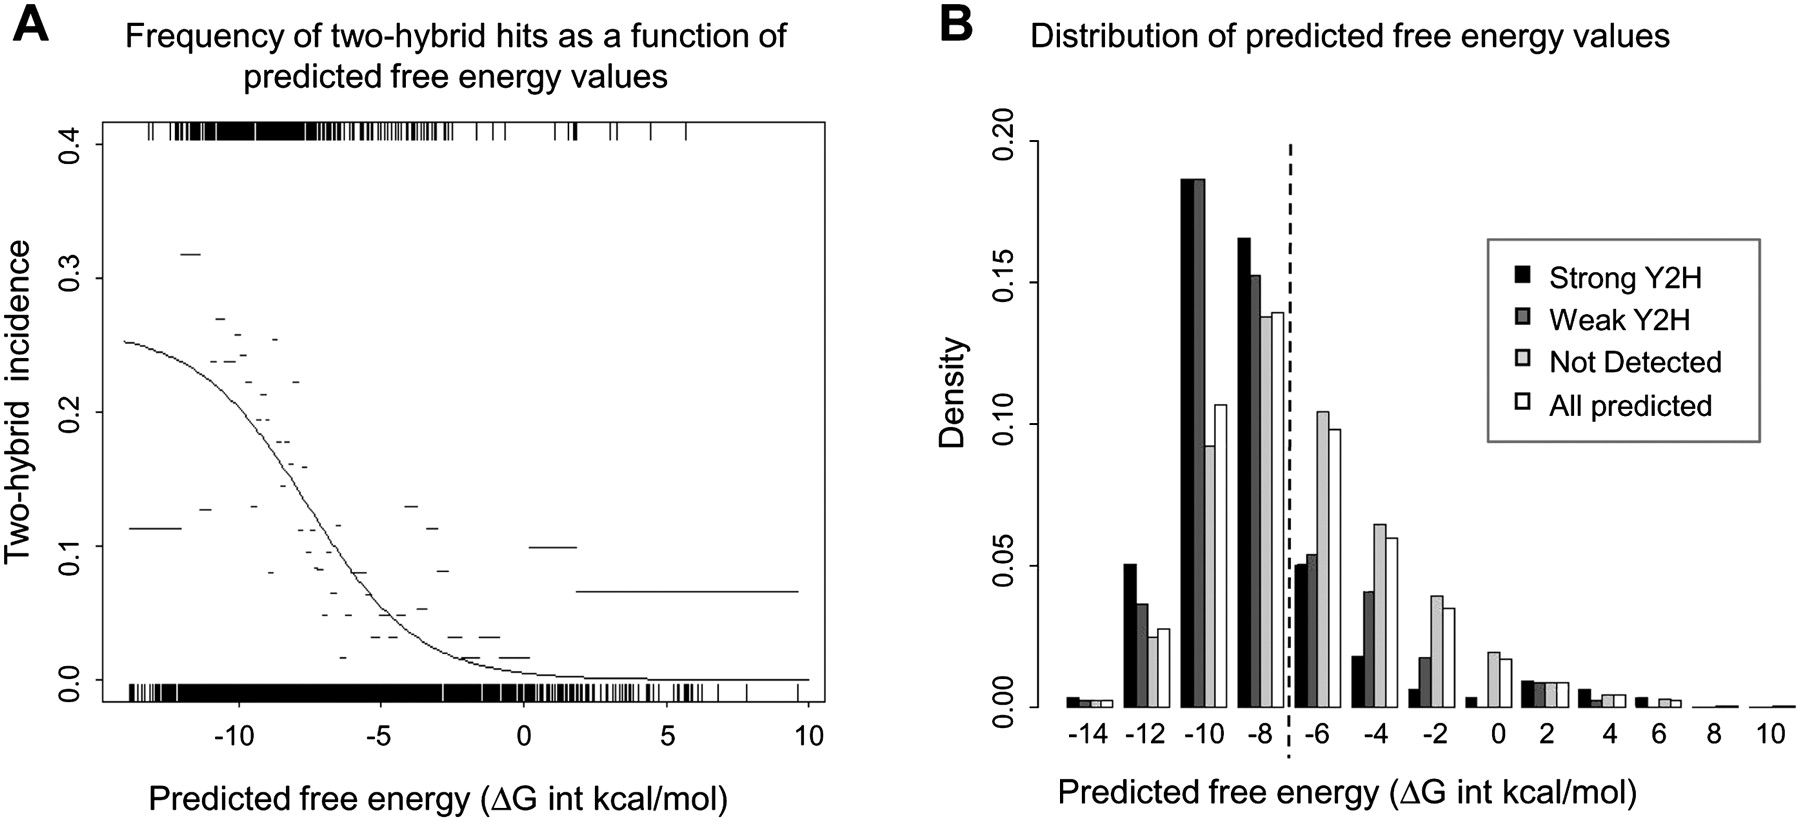
Comparison of data from targeted Y2H studies and true homology modeling methods. (A) To assess the ability of true homology modeling methods to predict the probability of detecting E2/E3-RING complexes in Y2H assays, the predicted free-energy values for 3150 E2/E3-RING complexes were compared with experimental profiles detected in Y2H studies. A binary score (1/0 = interaction was/was not observed) was assigned for each complex tested in Y2H assays. SigmaPlot 10.0 (Systat) was then used to fit the set of free-energy/binary score data pairs to the logistic model: p(Y2H interaction | free-energy score = x) = a / (1 + exp (−(x + b) / c)), with values for the parameters a, b, and c obtained by nonlinear regression. The resulting regression curve is shown in black. Black vertical lines indicate the distribution of the predicted free-energy values for interacting and noninteracting pairs on the upper and lower horizontal axes, respectively. Predicted free-energy values were ordered and split into bins of 200, and the frequency of Y2H interactions within each bin is shown as a gray horizontal bar (bar width indicates the free-energy values covered by each bin). (B) Distribution of free-energy values for all predicted human E2/E3-RING complexes (open bars); “strong” Y2H interactions selected on −Ade and −His + 2.5 mM 3AT plates (black bars); “weaker” Y2H interactions selected on −His + 2.5 mM 3AT plates (dark gray bars); interactions tested but not detected in Y2H studies (light gray bars). Dashed line indicates the approximate predicted free-energy values for the structurally defined UBE2L3–CBL complex (−7.87 ΔG int kcal/mol).


