
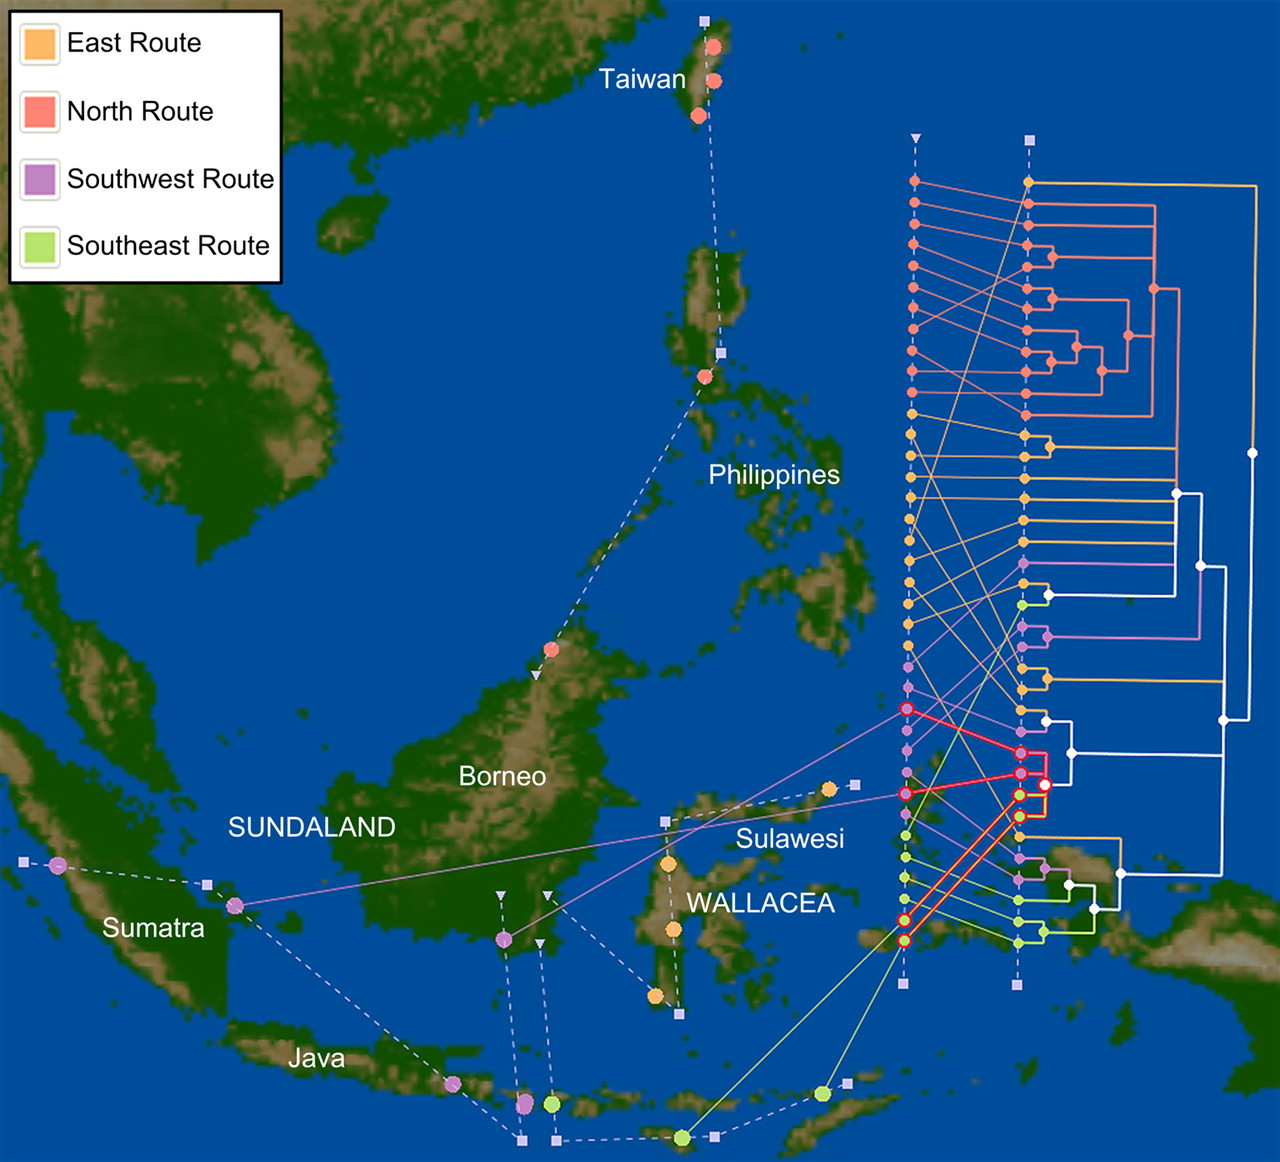
Map of Island Southeast Asia and Taiwan with hypothesized migration patterns of mtDNA haplogroup E1 encoded as geographic polylines. A triangle indicates the point of origin for each polyline on the island of Borneo. Most droplines connecting the geographic axis line to sample sites are omitted for clarity, but sites are colored according to their location relative to the proposed origin of haplogroup E1 and consequent migration route (Soares et al. 2008): Sulawesi (east) in orange, south Sundaland (south/southwest) in purple, south Wallacea (south/southeast) in green, and the northern points in pink. The optimal tree layout with 78 crossings is shown, with colored branches indicating leaves or groups of leaves that were exclusive to a single region once dereplication had been carried out (see Supplemental Methods). One southern subclade of E1 that contains both southeastern and southwestern sequences is highlighted, showing droplines that connect to its corresponding geographic locations.


