
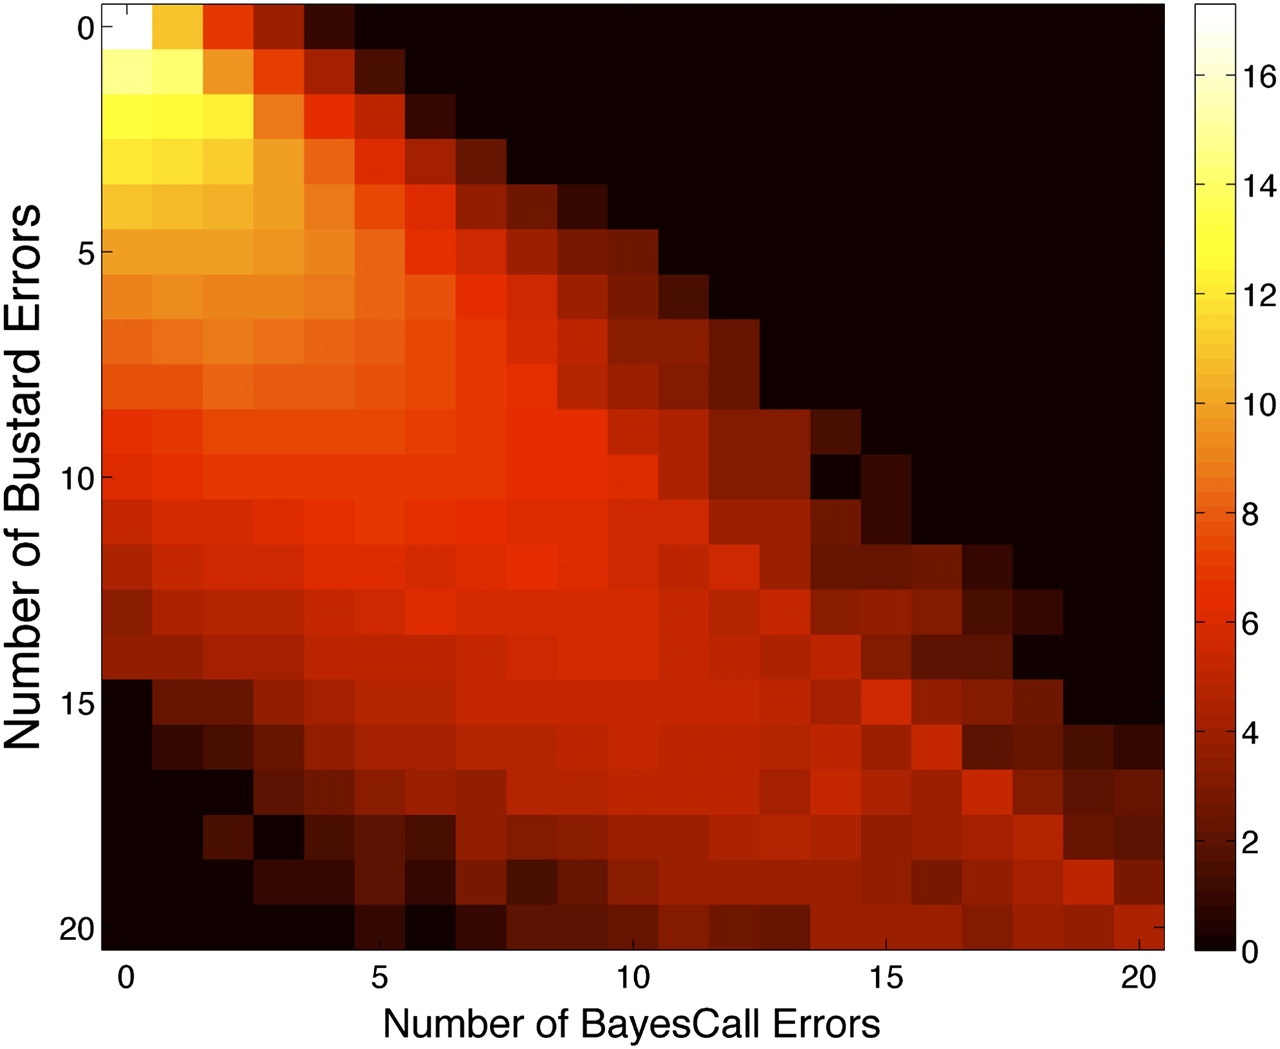
Figure 7.
Heat plot of joint errors in Bustard and BayesCall for the 76-cycle phiX174 data. This plot depicts the joint error matrix shown in Table 3. The (x,y) entry in the plot corresponds to log2 of the number of reads with x errors in Bustard and y errors in BayesCall. This plot clearly illustrates that BayesCall generally produces sequence reads with substantially fewer errors than that produced by Bustard.


