
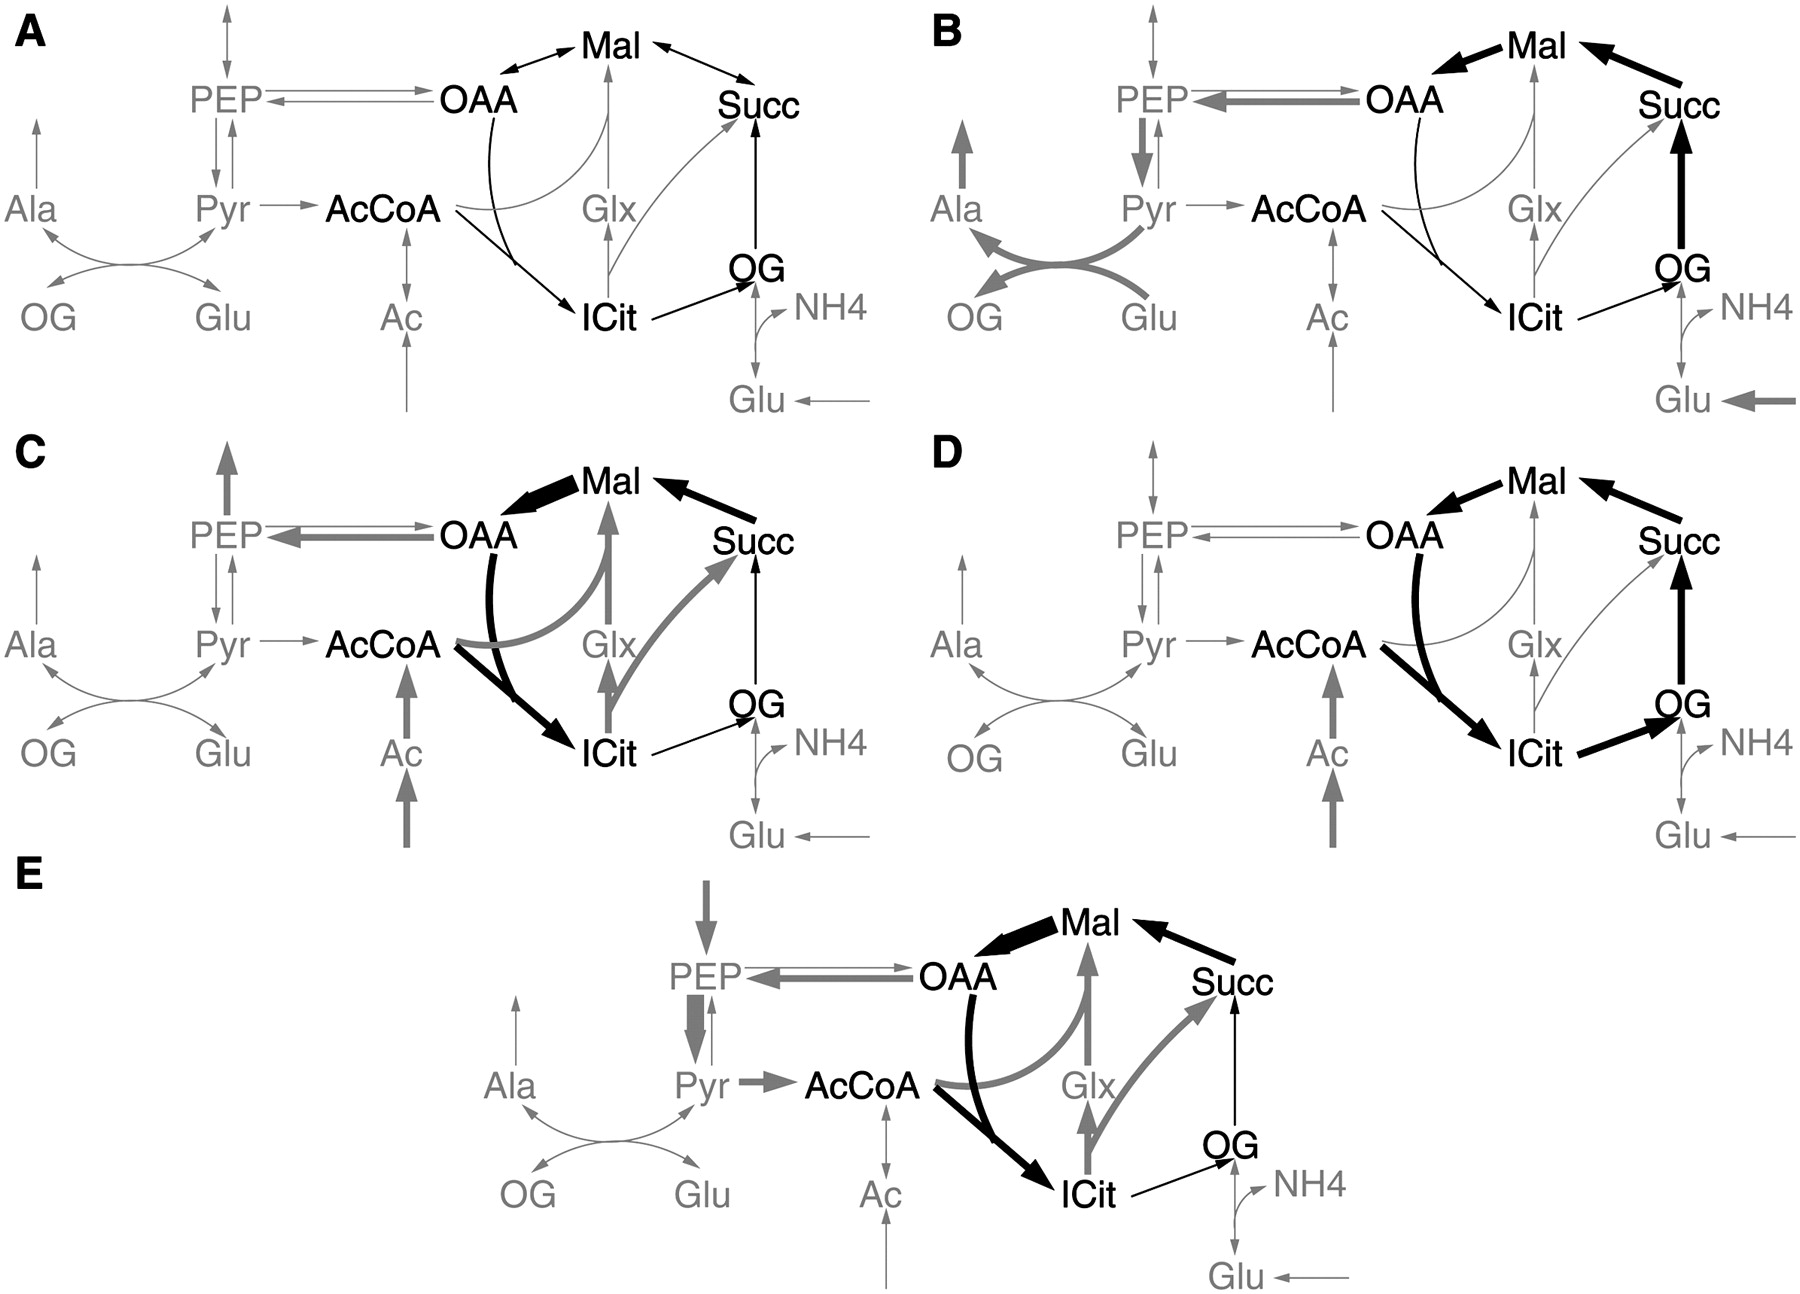
Elementary flux patterns in a condensed model of the TCA cycle and adjacent reactions. (A) Model of the entire network. The TCA cycle is chosen as a subsystem (dark reactions). (B–D) Elementary flux patterns of the system are indicated by thick black arrows. The associated pathway through the entire system is indicated by thick gray arrows. The thickness of the arrows corresponds to the relative flux through each reaction. (E) Alternative pathway through the entire system using the same reactions of the flux pattern depicted in C. While the pathway in C corresponds to the glyoxylate cycle that can be used for growth on fatty acids, E corresponds to the phosphoenolpyruvate-glyoxylate cycle used as a catabolic pathway during growth on low glucose concentrations (Fischer and Sauer 2003). A list of abbreviations can be found in Supplemental material S2.


