
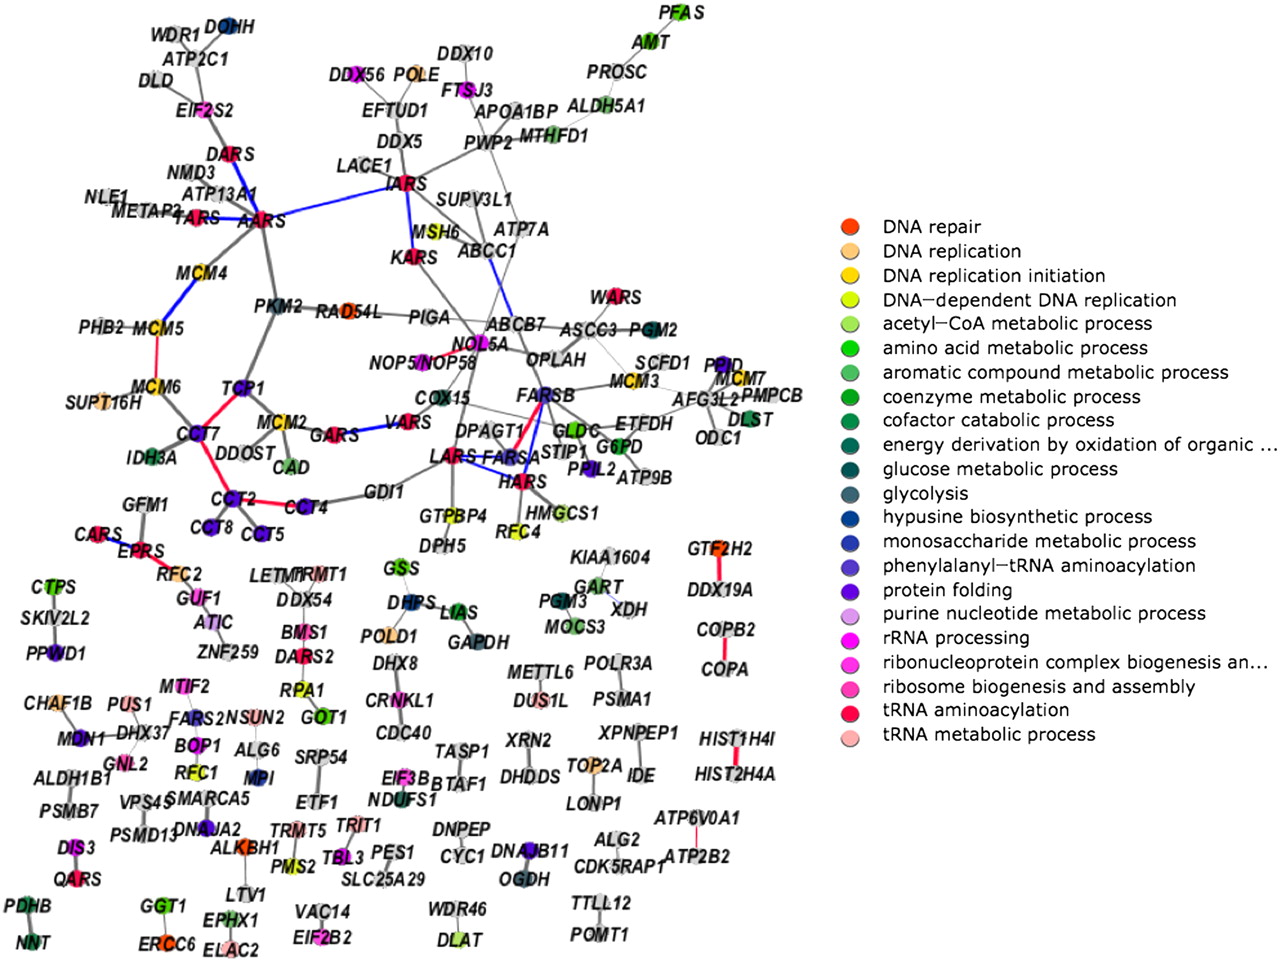
Figure 5.
The coevolution network (#1 from Supplemental Table 1) of the most strongly coevolving proteins is shown with known physical protein interactions as red lines, and with KEGG pathway sharing as blue lines. The width of the lines is proportional to the MMM score minus the score to the average matrix. The proteins (nodes in the graph) are colored according to their GO annotation with the highest connectivity in the network. Given the detail in this figure, we also make it available as a supplemental Cytoscape file for more convenient viewing and manipulation.


