
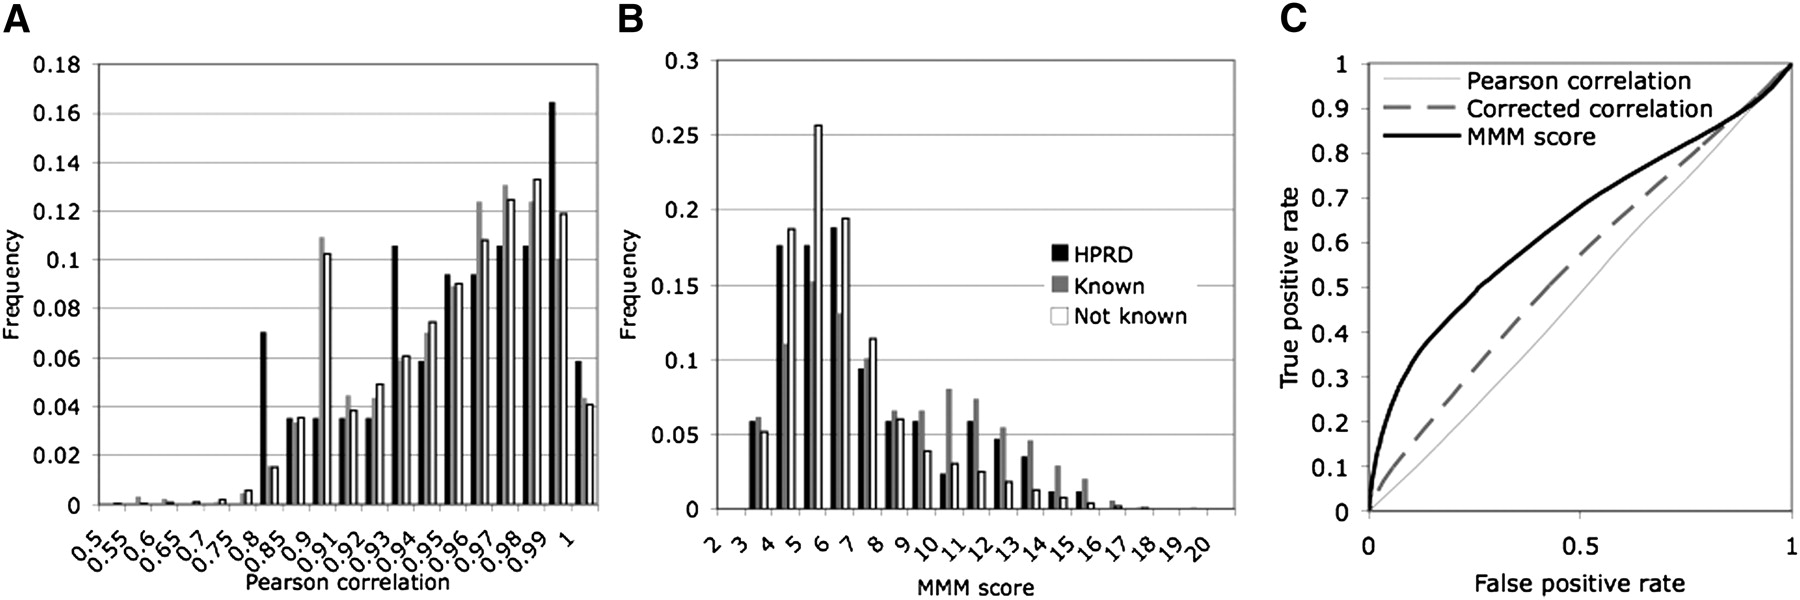
Comparison of matrix correlation scores and MMM scores. (A) The distribution of the frequency of known interactions for different degrees of Pearson correlation coefficient is plotted for the 106,179 matrix pairs with equal size and taxonomic distribution. The Pearson correlation scores are very high and do not segregate known interactions, nor high-quality interactions (HPRD). Key shown in B is the same as for A. (B) We do, however, see a clear excess of known and HPRD interactions with high MMM scores. A ROC curve shows that the accuracy of the Pearson correlation is improved when corrected for phylogenetic signal, and that the MMM score is still a better predictor. MMM was run with a tolerance of 0.2 and no step function.


