
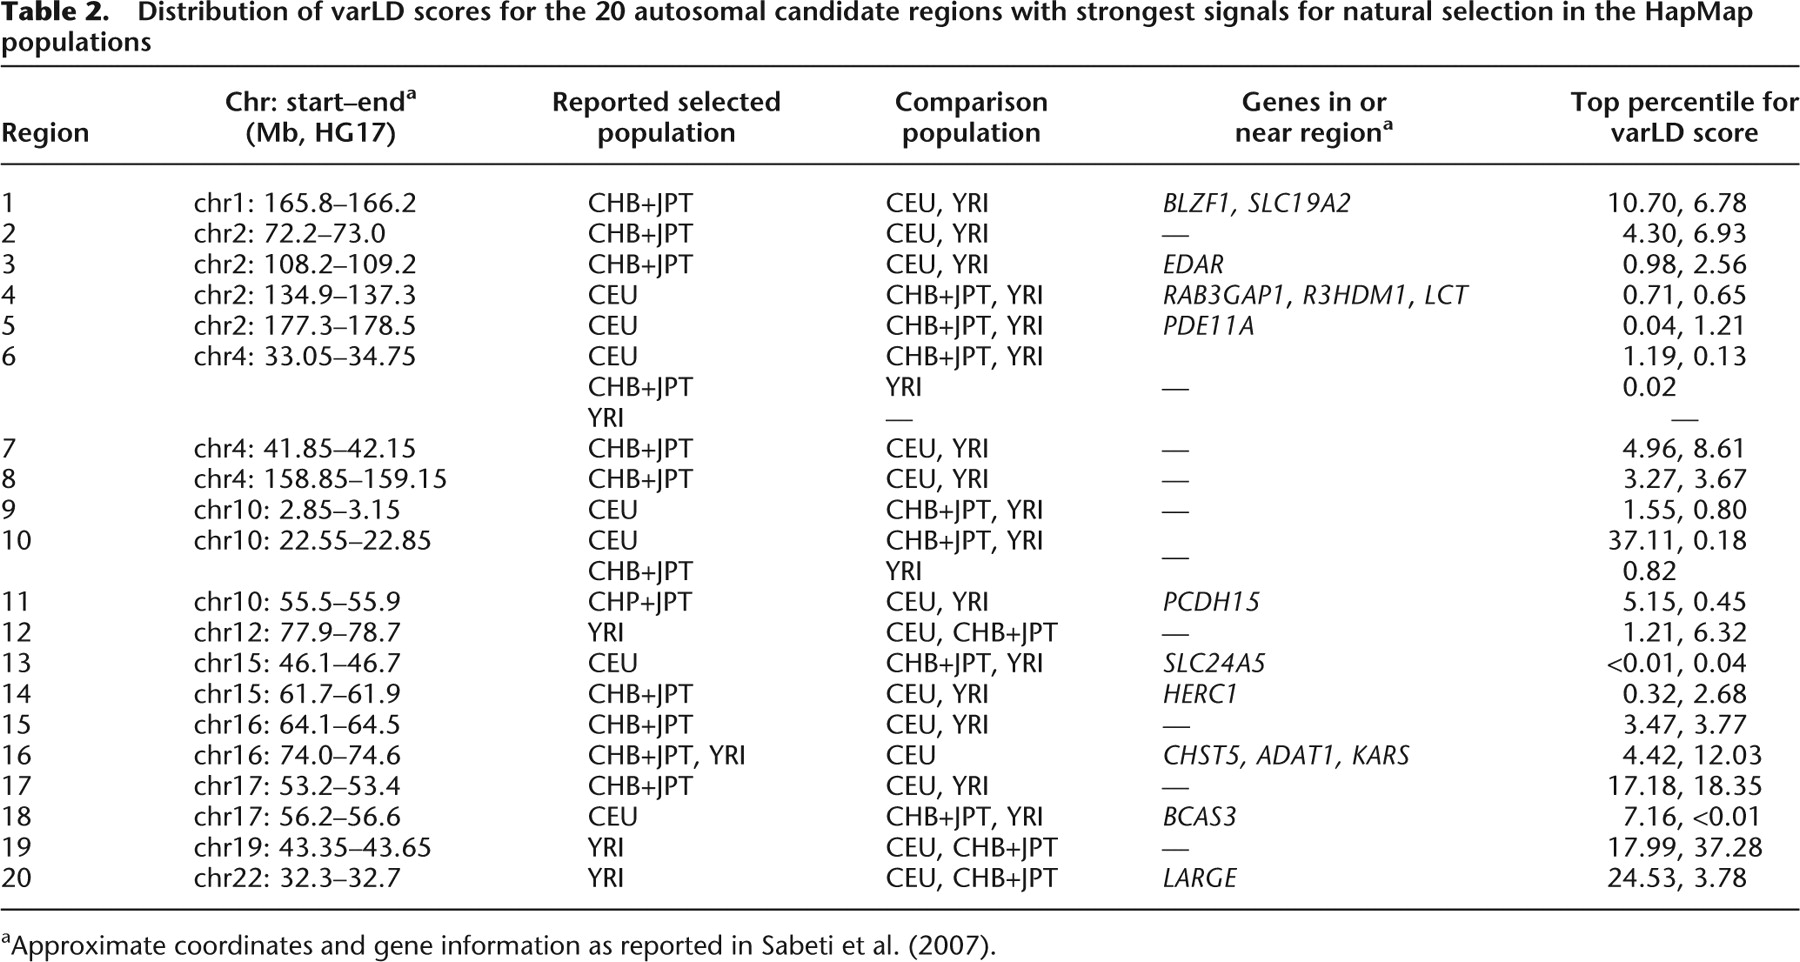
Table 2.
Distribution of varLD scores for the 20 autosomal candidate regions with strongest signals for natural selection in the HapMap populations
Click on table to view larger version.
-
aApproximate coordinates and gene information as reported in Sabeti et al. (2007).


