
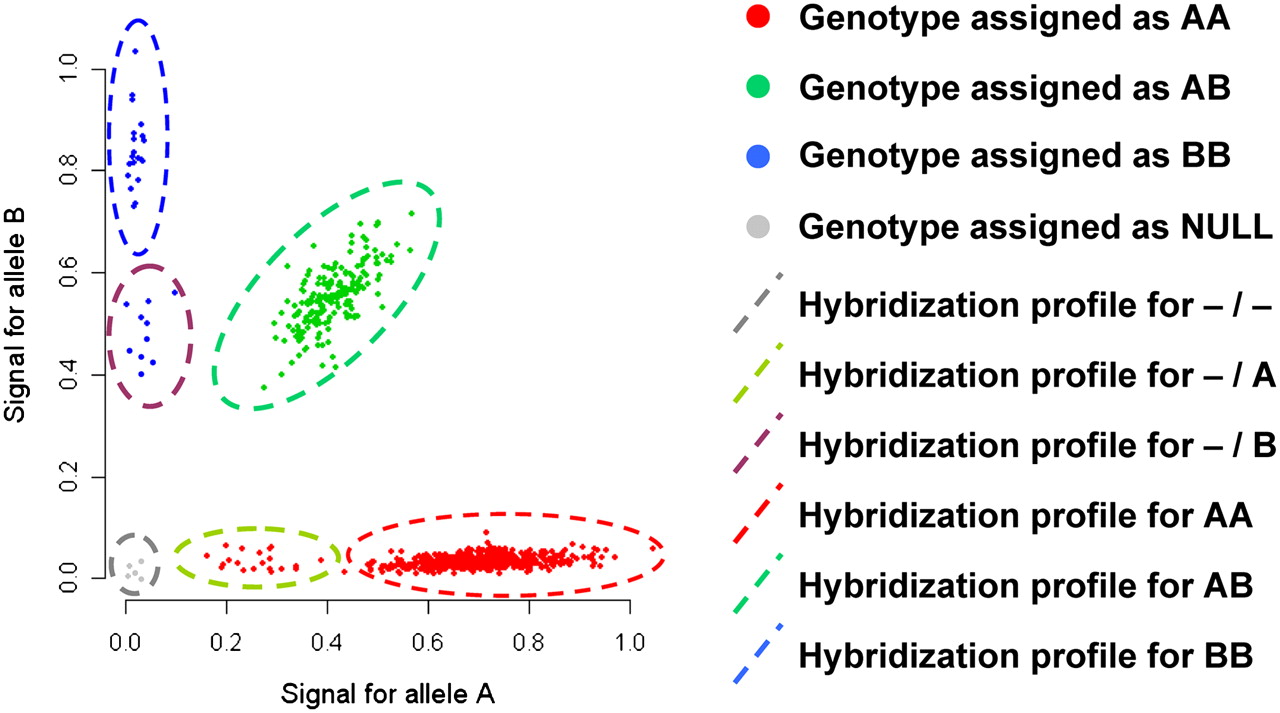
Genotype assignment and hybridization intensity profiles of a SNP in a region containing deletions. The two axes represent the fluorescence intensities that indicate the extent of hybridization to the two possible alleles of a biallelic SNP, which have been generically defined as alleles A and B. Solid circles in red, green, blue, and gray indicate samples whose genotypes have been assigned as AA, AB, BB, and NULL (missing), respectively. (Dashed ellipses) Intensity profiles that correspond to homozygous deletion (gray), hemizygous A deletion (light green), hemizygous B deletion (purple), genotype AA (red), genotype AB (dark green), and genotype BB (blue). The figure illustrates that samples with hemizygous deletions have been erroneously assigned to homozygous genotypes, while samples with homozygous deletions have been classified as missing.


