
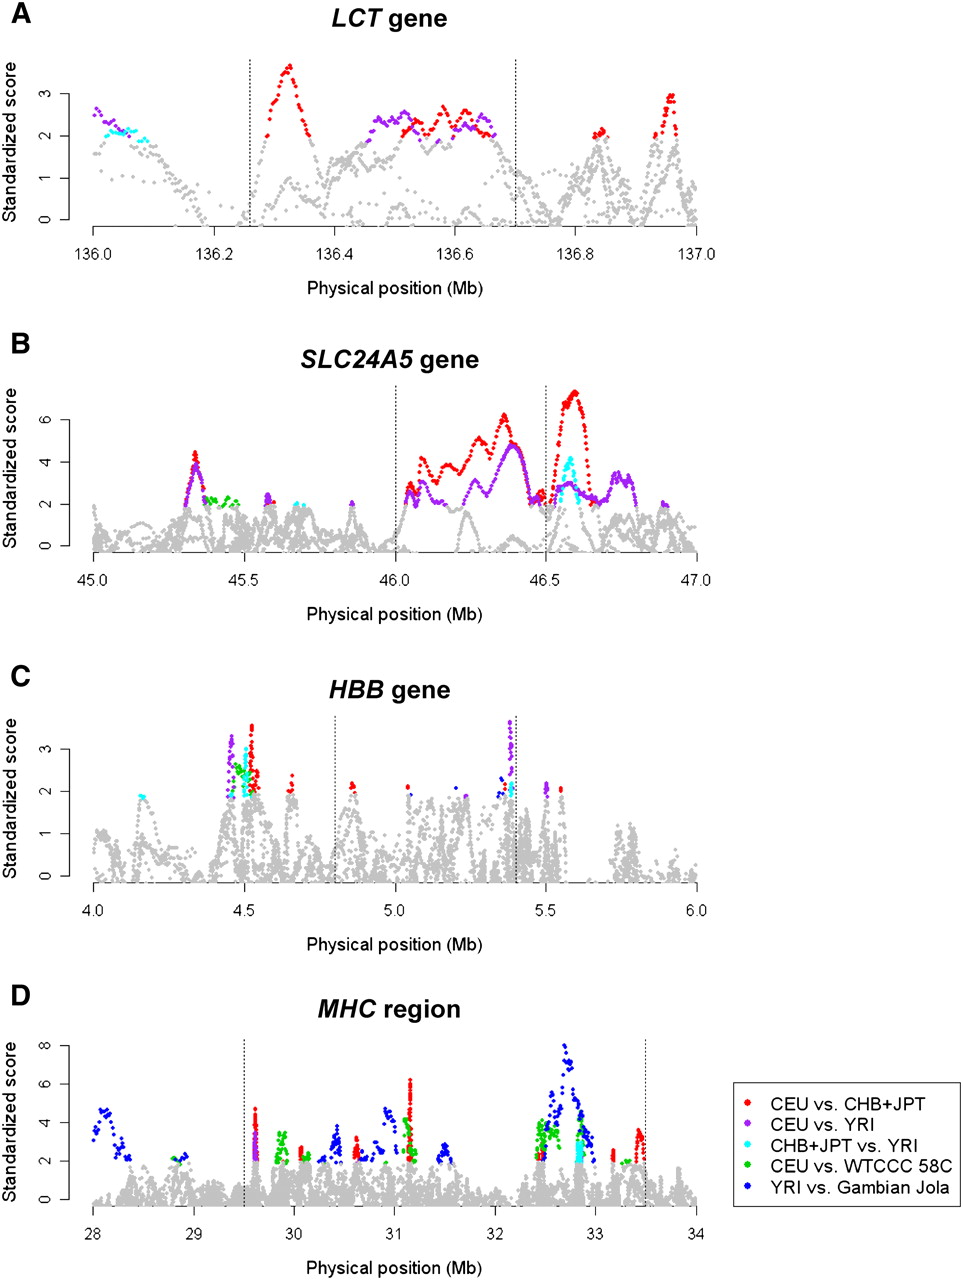
Standardized varLD scores across different population pairs in established regions undergoing positive natural selection or containing high haplotype diversity. The standardized varLD signals for each population pair are shown, and only scores above their respective 95th quantiles are illustrated in a nongray color. (Red points) LD comparisons between HapMap Europeans (CEU) and HapMap Asians (CHB and JPT); (purple points) LD comparisons between HapMap Europeans (CEU) and HapMap Africans (YRI); (cyan points) LD comparisons between HapMap Africans (YRI) and HapMap Asians (CHB and JPT); (green points) LD comparisons between two European populations (HapMap CEU vs. WTCCC 58C); (blue points) LD comparisons between two African populations (HapMap YRI vs. the Gambian Jola). The four regions considered contain the LCT gene in chromosome 2 undergoing selection in European populations (A), the SLC24A5 gene in chromosome 15 reported for association with skin pigmentation in Europeans (B), the HBB gene in chromosome 11 with well-documented haplotypic differences between the two populations considered (C), and the highly polymorphic MHC region in chromosome 6 (D). (Dotted lines) Approximate start and end positions of the gene/region in each panel.


