
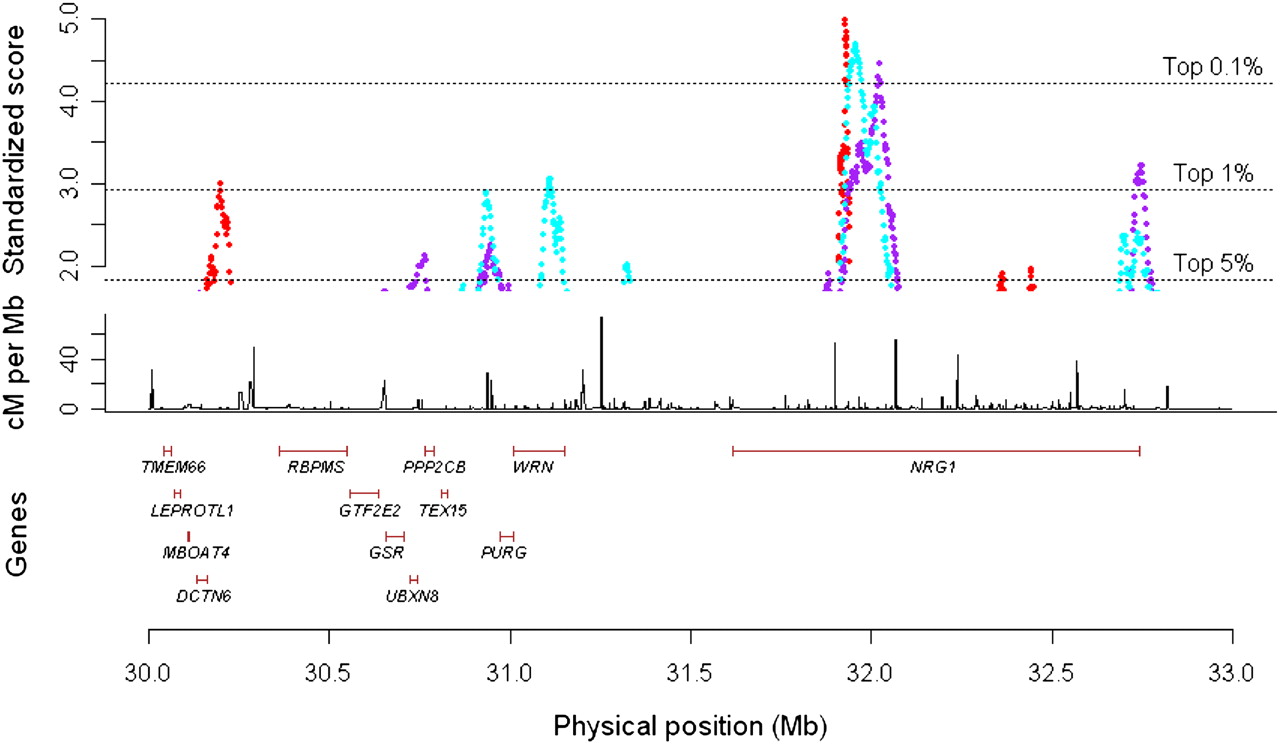
LD variation at the NRG1 gene on chromosome 8. (Upper panel) Standardized varLD scores across the region encapsulating the NRG1 gene. (Red points) LD comparisons between HapMap Europeans (CEU) and HapMap Asians (CHB and JPT); (purple points) LD comparisons between HapMap Europeans (CEU) and HapMap Africans (YRI); (cyan points) LD comparisons between HapMap Africans (YRI) and HapMap Asians (CHB and JPT). (Dotted lines) Values of the corresponding thresholds. (Middle panel) Fine-scale recombination rates in the region from the combined HapMap samples. Positions of genes in the region shown in the bottom panel were obtained from Ensembl. All coordinates shown are in NCBI Build 35 (dbSNP build 125).


