
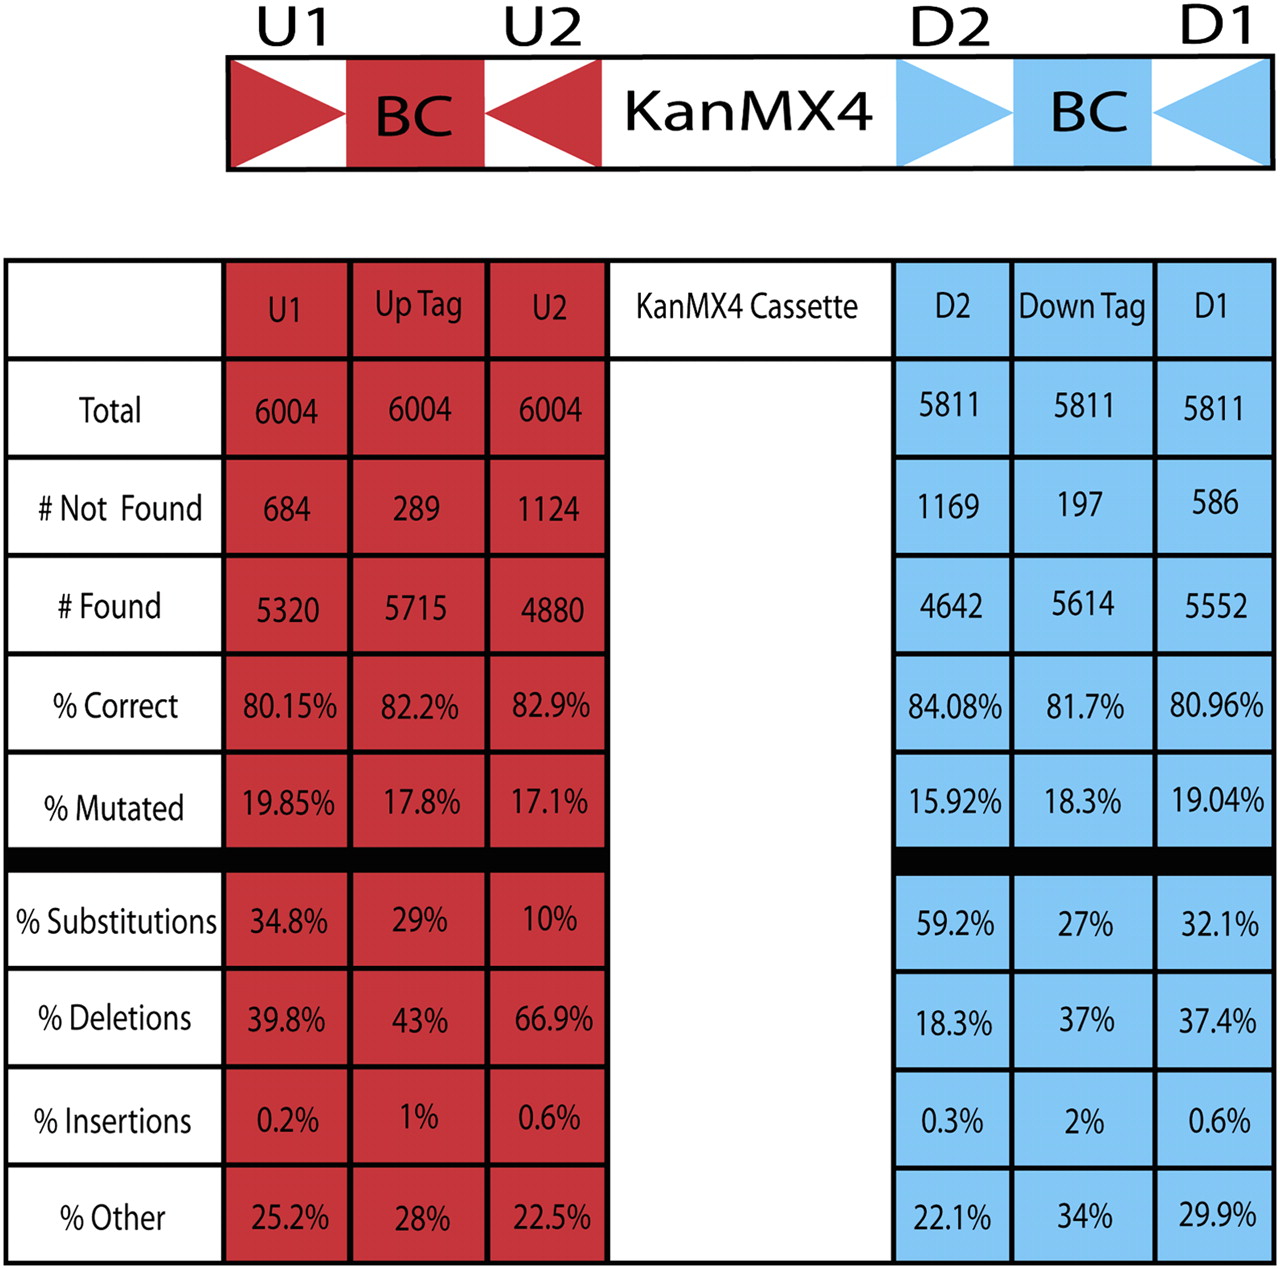
Yeast knockout collection characterization. (Top) An illustration of the yeast deletion cassette; (bottom) the table represents the total number of barcodes found, the percent correct (i.e., sequences found to exactly match the designed sequence), and the percent incorrect (i.e., sequences found to deviate from the expected sequence). Also shown is a breakdown of the incorrect sequences that were identified. This breakdown includes the percentage of single substitutions, single deletions, single insertions, and other mutations (i.e., multiple deletions). These data were collected in two paired-end sequencing reactions and two single sequencing reactions. For details, see Supplemental Methods.


