
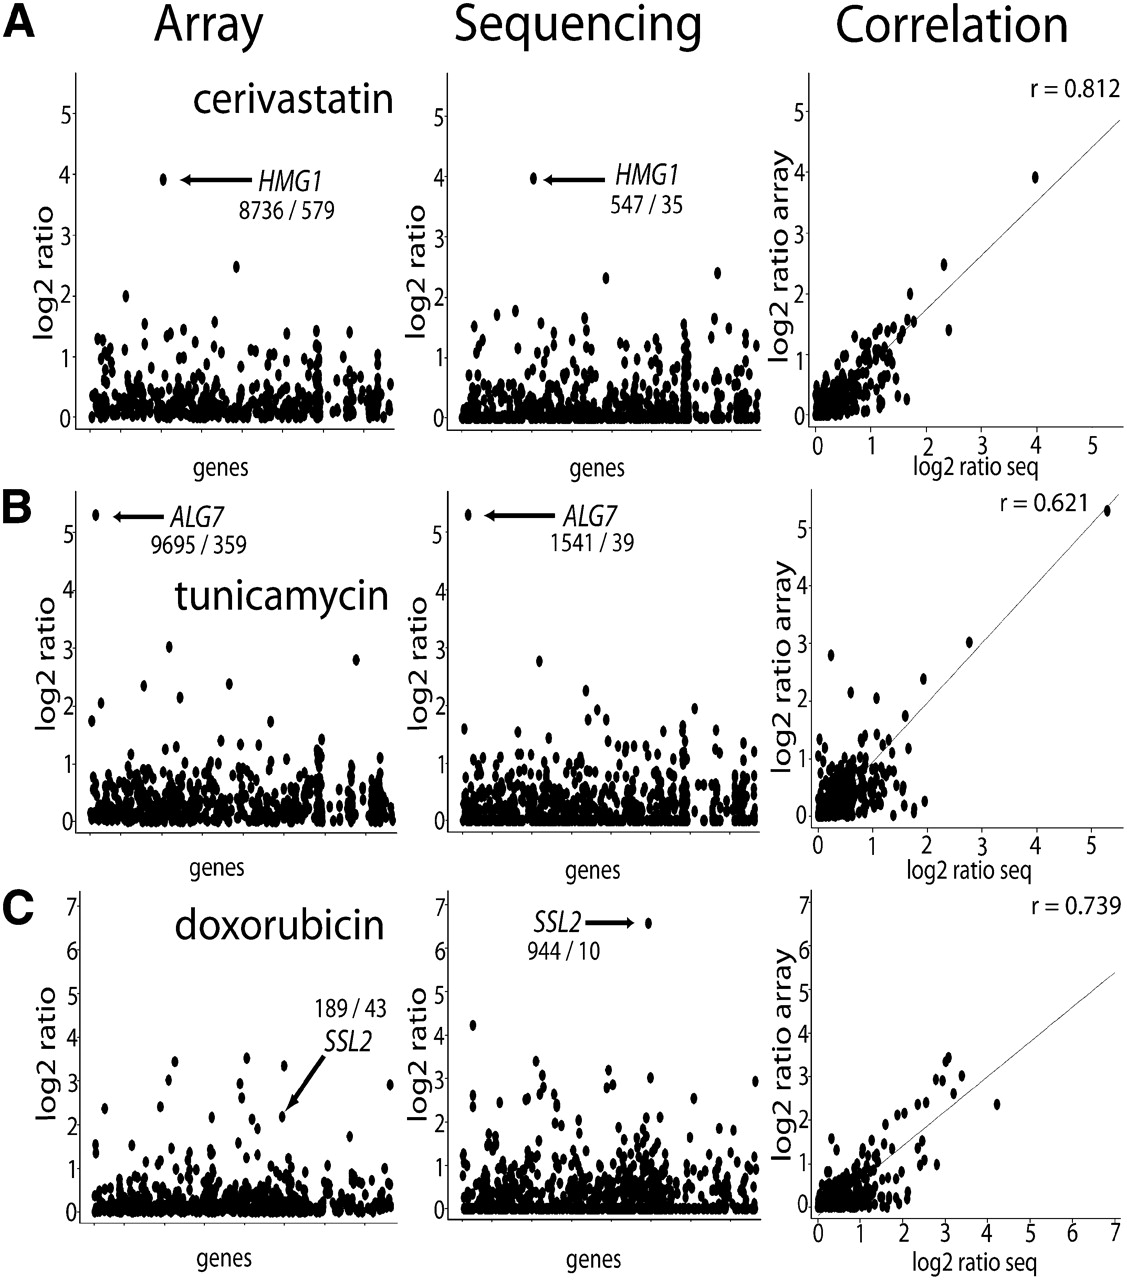
Results of the yeast deletion pools assayed by array and Bar-seq. Log2 results for both TAG4 barcode microarray hybridization and Illumina sequencing are presented. All axes represent log2 ratios of control over treatment vs. genes (alphabetically ordered). (A,B) Results for the downtags for the drug treatments of the constant pool for (A) cerivastatin and (B) tunicamycin. (C) Results for the heterozygote essential pool treated with doxorubicin. The r-value in the righthand column indicates the correlation of the log2 ratios between the array vs. sequencing data. (Arrow) Known drug targets are labeled. The sequencing data were collected using a single sequencing reaction for four independent samples (four-plex). The correlation data were filtered based on greater than 10 counts in the Bar-seq DMSO control and an intensity of more than 200 in the DMSO array control, prior to correlation calculation. These data were collected in four-plex sequencing reactions. For details, see Methods.


