
Table 2.
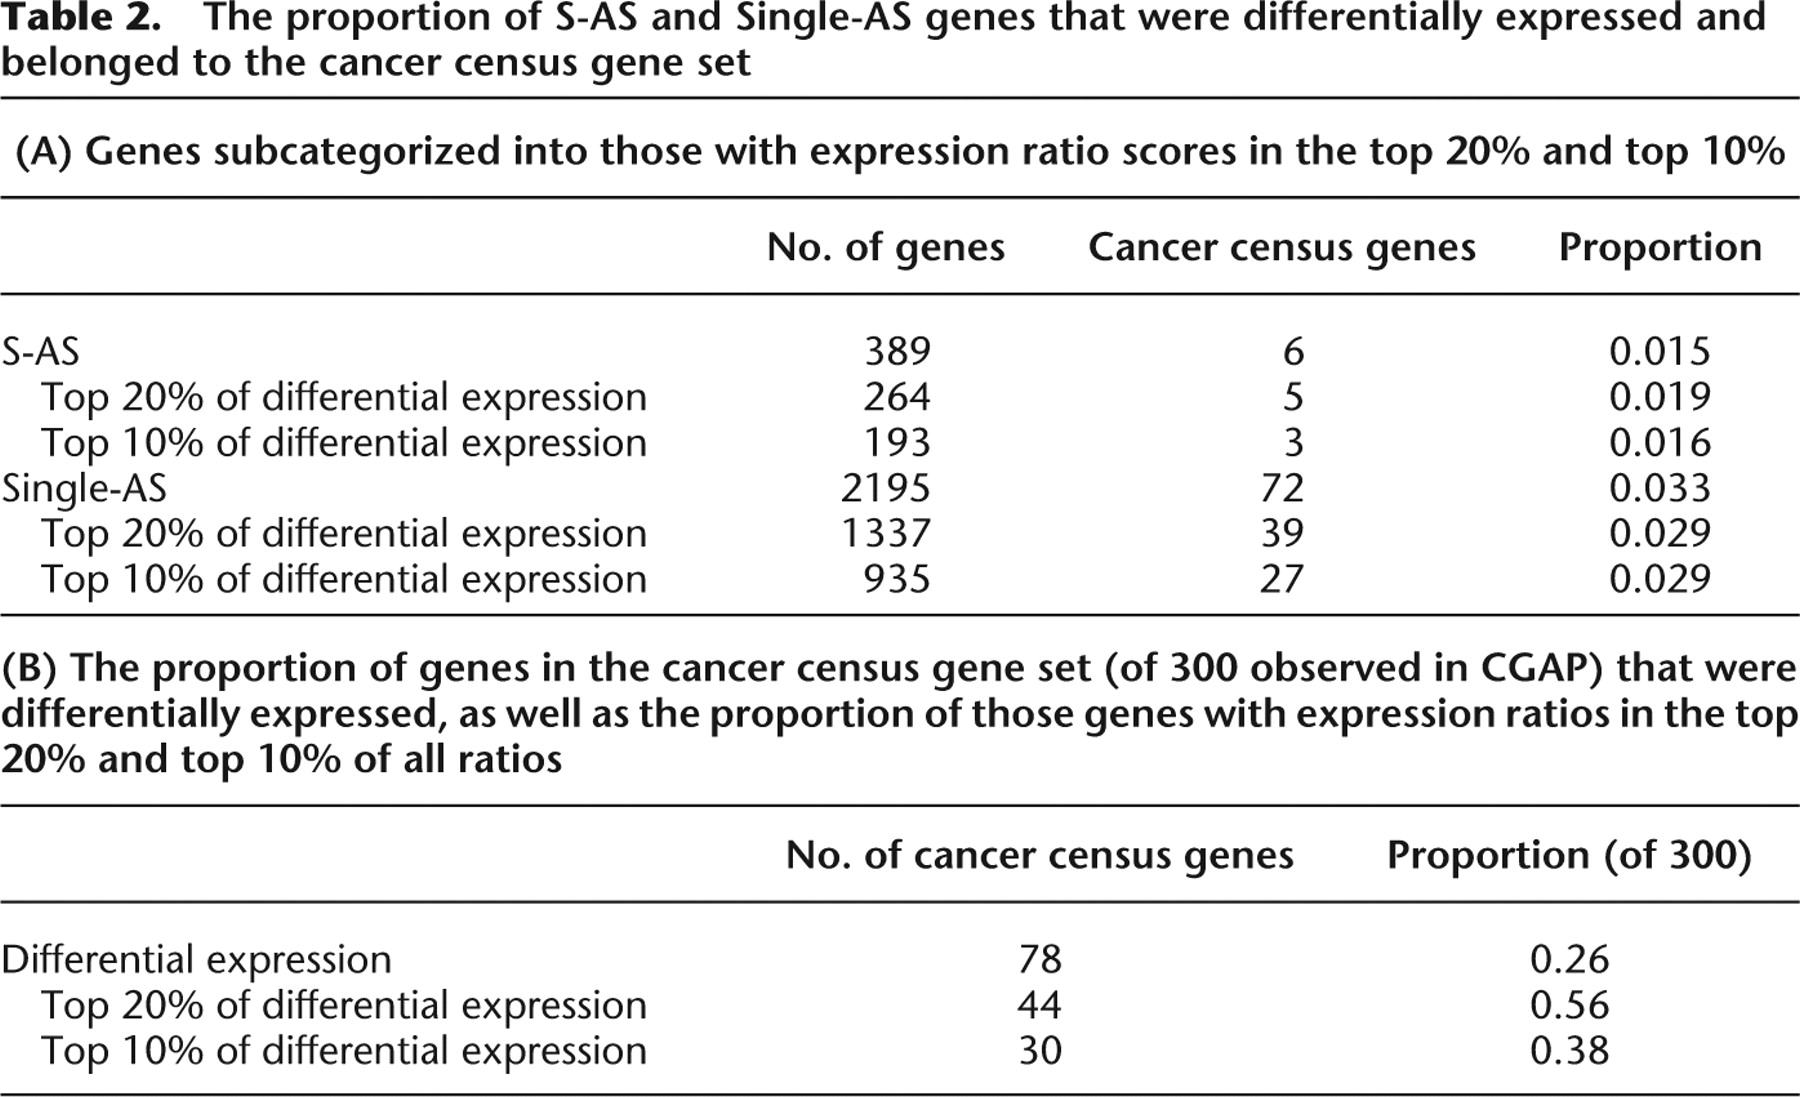
The proportion of S-AS and Single-AS genes that were differentially expressed and belonged to the cancer census gene set
Click on table to view larger version.
Click on image to view larger version.
The proportion of S-AS and Single-AS genes that were differentially expressed and belonged to the cancer census gene set
Click on table to view larger version.
 CiteULike
 Delicious
 Digg
Digg Facebook
 Google+
 Reddit
 Twitter
