
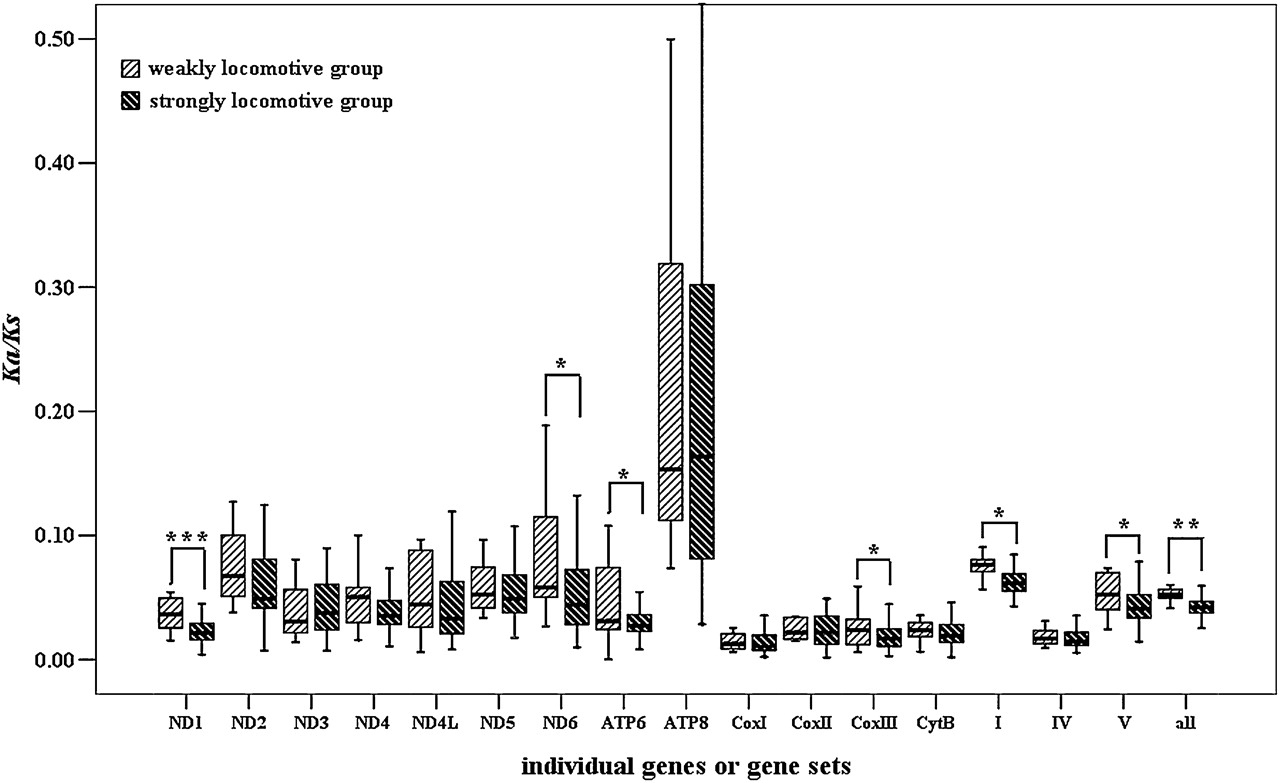
Figure 3.
Comparisons of average Ka/Ks ratios for 13 individual genes, genes involved in complexes I, IV, and V, and 13 protein-coding genes set between weakly and strongly locomotive groups. Boxes include 50% of the distributions. ND1, P < 0.001; ND2, P > 0.05; ND3, P > 0.05; ND4, P > 0.05; ND4L, P > 0.05; ND5, P > 0.05; ND6, P < 0.05; ATP6, P < 0.05; ATP8, P > 0.05; COXI, P > 0.05; COXII, P > 0.05; COXIII, P < 0.05; CytB, P > 0.05; complex I, P < 0.05; complex IV, P > 0.05; complex V, P < 0.05; all genes, P < 0.001. Note: *P < 0.05, **P = 0.05–0.001, ***P < 0.001.


