
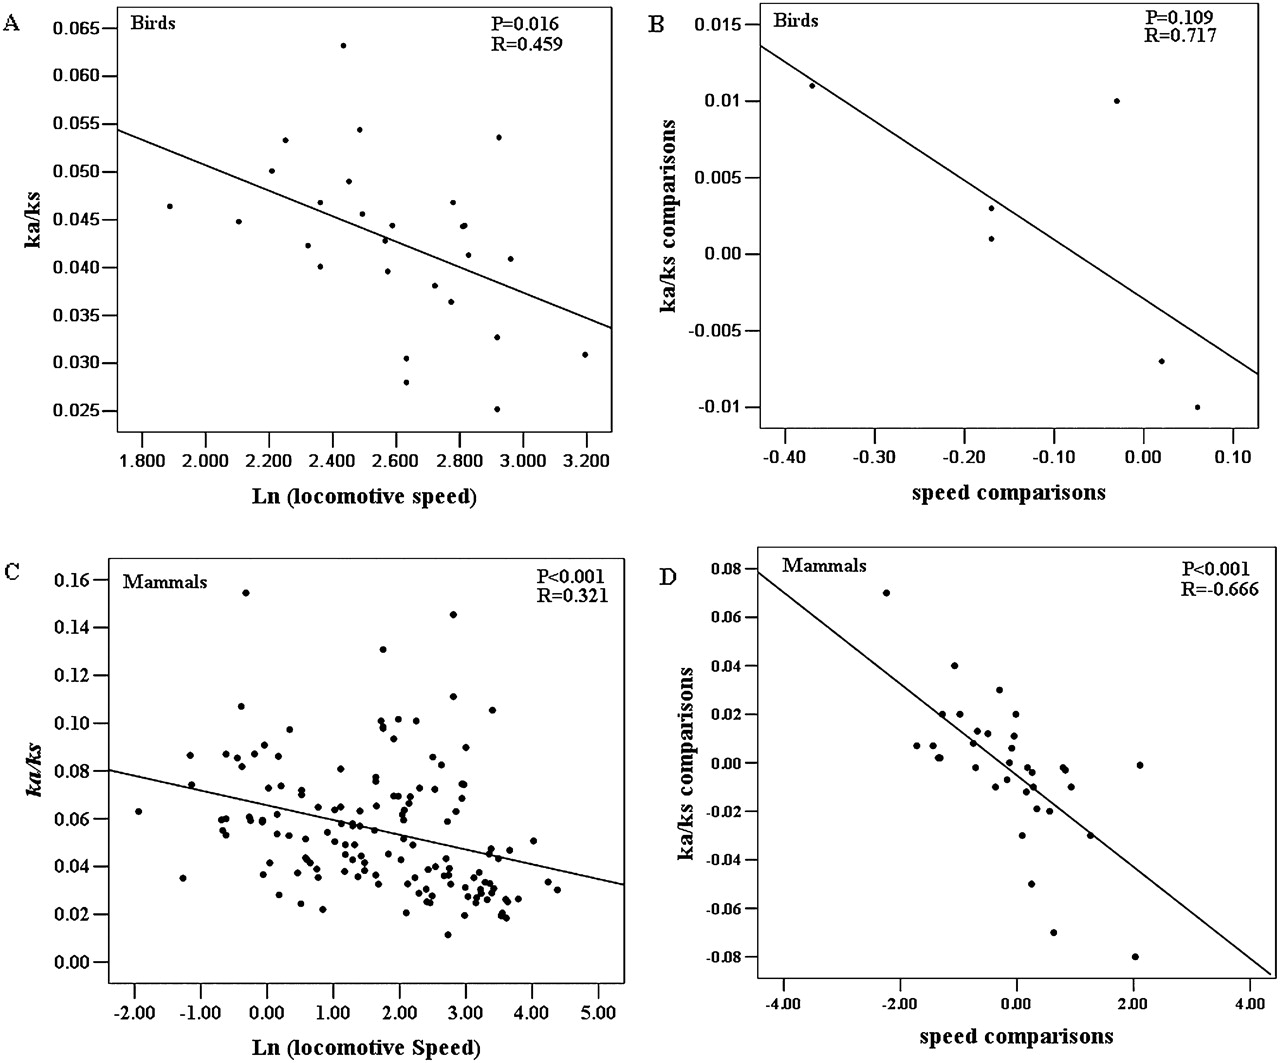
Figure 2.
Negative correlation between mitochondrial Ka/Ks ratios and locomotive speed. (A) Ordinary linear regressions of Ka/Ks ratios to loge speed for 27 avian species, raw cross-species values, P = 0.016, R = 0.459. (B) Phylogenetically independent contrasts for six pairs of birds, P = 0.109, R = 0.717. (C) Ordinary linear regressions of Ka/Ks ratios to loge speed for 131 mammalian species, raw cross-species values, P < 0.001, R = 0.321. (D) Phylogenetically independent contrasts for 36 pairs of mammals, P < 0.001, R = −0.666.


