
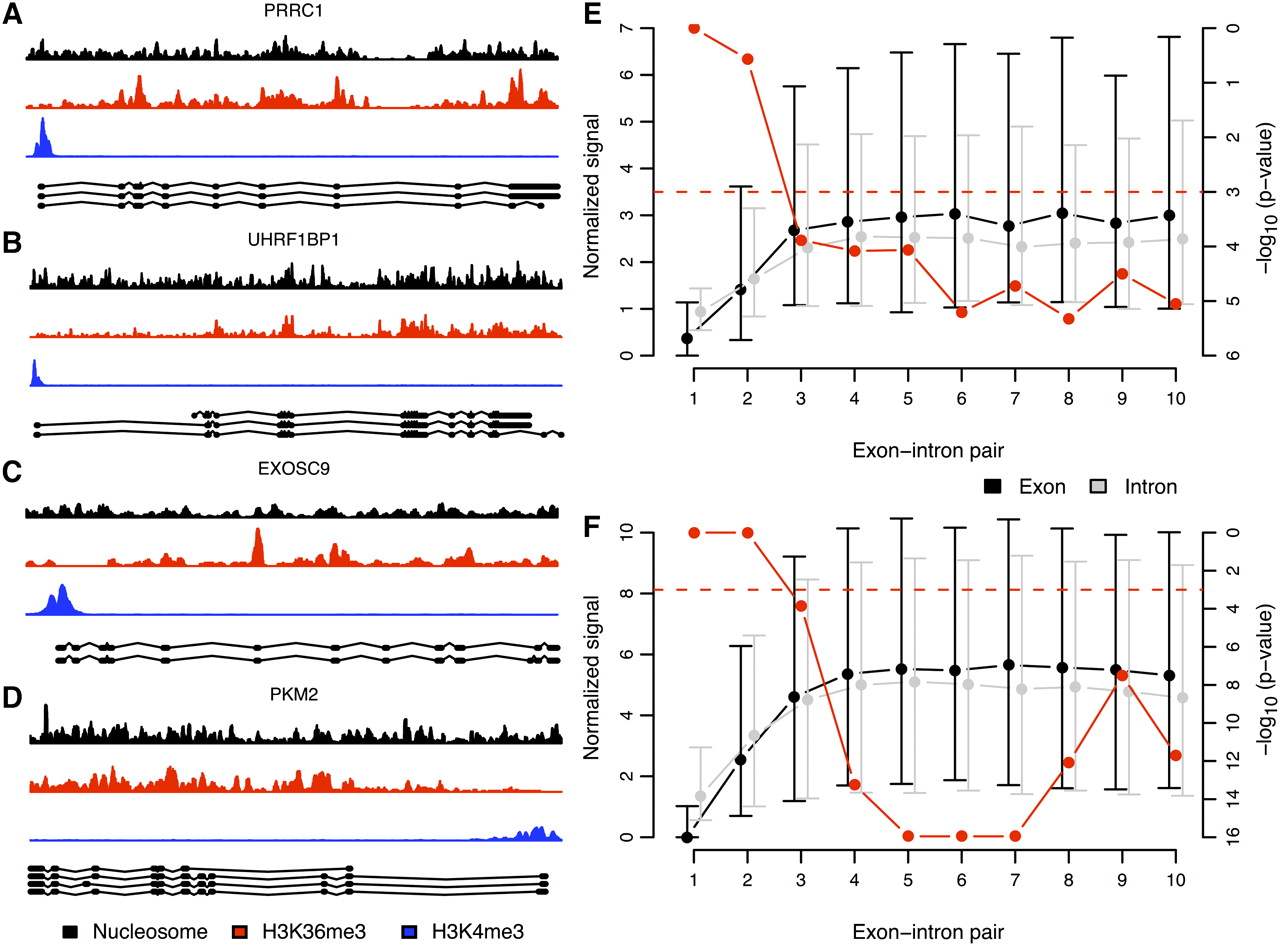
H3K36me3 signal is overrepresented at internal exons with respect to succeeding introns. (A–D) Example of nucleosome (black), H3K36me3 (red), and H3K4me3 (blue) signal in the human PRRC1 (A), UHRF1BP1 (B), EXOSC9 (C), and PKM2 (D) genes. Ensembl transcripts and corresponding exons are shown below the H3K4me3 signals. Most H3K36me3 signal peaks coincide with the location of exons. (E,F) Median (dots) and interquartile ranges (vertical lines) of average normalized (see Fig. 1) H3K36me3 signal in highly expressed genes in exons (black) and the corresponding succeeding introns (gray) (left vertical axes) in human T-cells (E) and mouse embryonic stem cells (F). The exons are grouped with corresponding succeeding introns in exon–intron pairs. In each exon–intron pair, say, 3, we assure that no exon of lower rank, i.e., 1 or 2, occurs in any annotated Ensembl transcript (see Methods for details). We depict in red (right vertical axes) paired Wilcoxon signed rank test P-values on the alternative hypothesis that signal in exons is higher than in corresponding succeeding introns. The dashed red line indicates a P-value of 0.001.


