
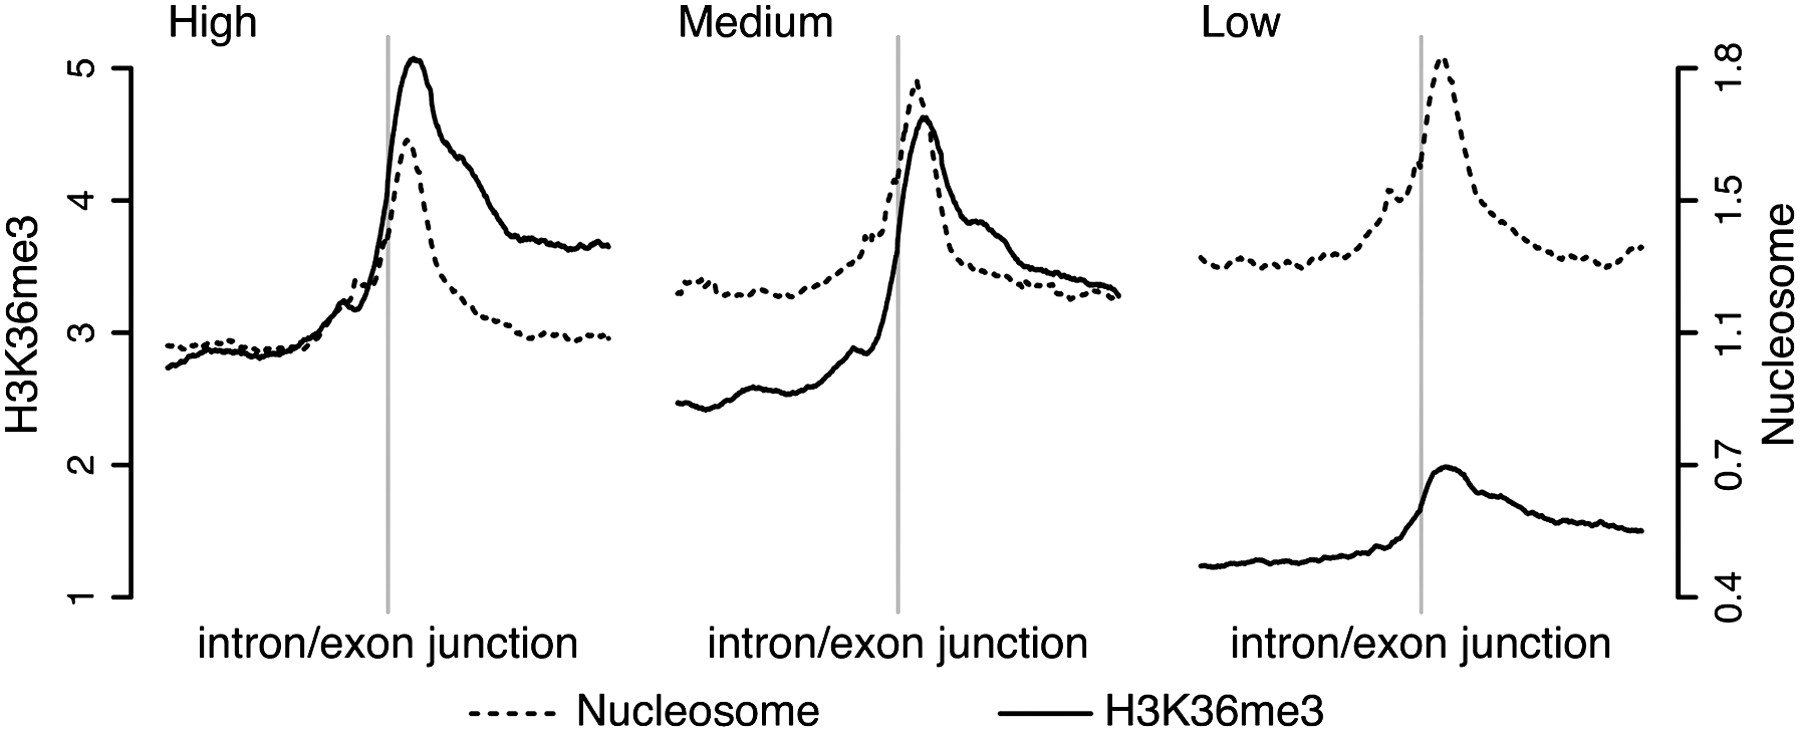
Figure 2.
H3K36me3 signal is high at internal exons of highly expressed genes. Footprints of normalized (see Fig. 1) H3K36me3 (solid line) and nucleosome (dashed line) signal in human T-cells in a ±1-kb window centered at intron/exon junctions of internal exons in genes with high, medium, and low expression.


