
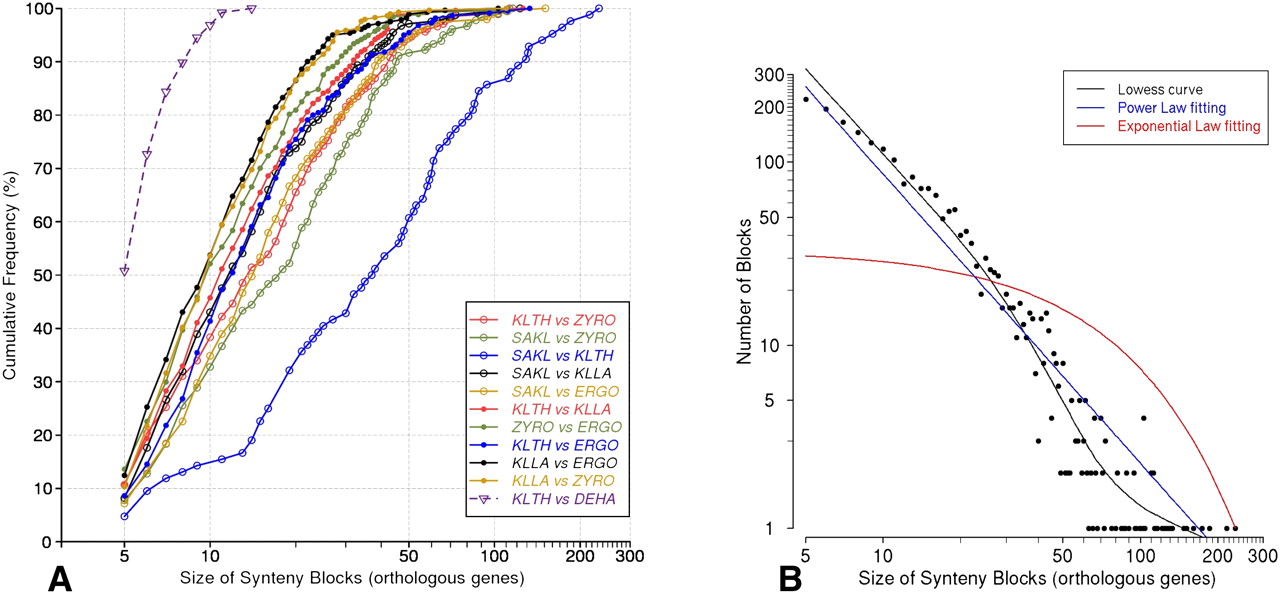
Figure 4.
Size of synteny blocks. (A) Distribution of sizes of synteny blocks (log scale abscissae) between all pairs of protoploid Saccharomycetaceae. The same distribution for synteny blocks between K. thermotolerans and an outgroup species (D. hansenii) is shown for comparison. Species abbreviations as in Figure 2. (B) Frequency distribution of synteny blocks (log scale ordinate) between all pairs of protoploid Saccharomycetaceae according to size (log scale abscissa).


