
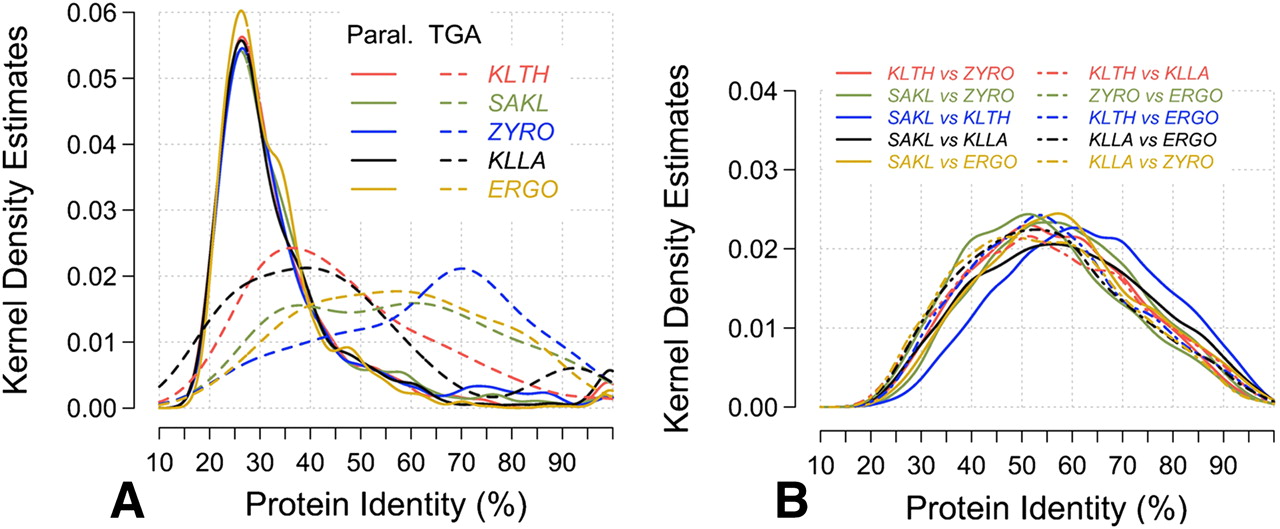
Figure 3.
Distribution of amino acid sequence identities between pairs of homologous proteins. Pairs of orthologous (as defined from SONS) or paralogous proteins (defined from protein families) were used to compute the distributions. (A) Paralogs; (B) orthologs. Amino acid identities were calculated from BLAST alignments with low complexity filter. Each distribution was computed from all pairwise alignments between two species for orthologs, and from pairwise alignments within families of two and three members for paralogs. (Solid lines) Dispersed paralogs; (dashed lines) TGAs; species abbreviations as in Figure 2.


