
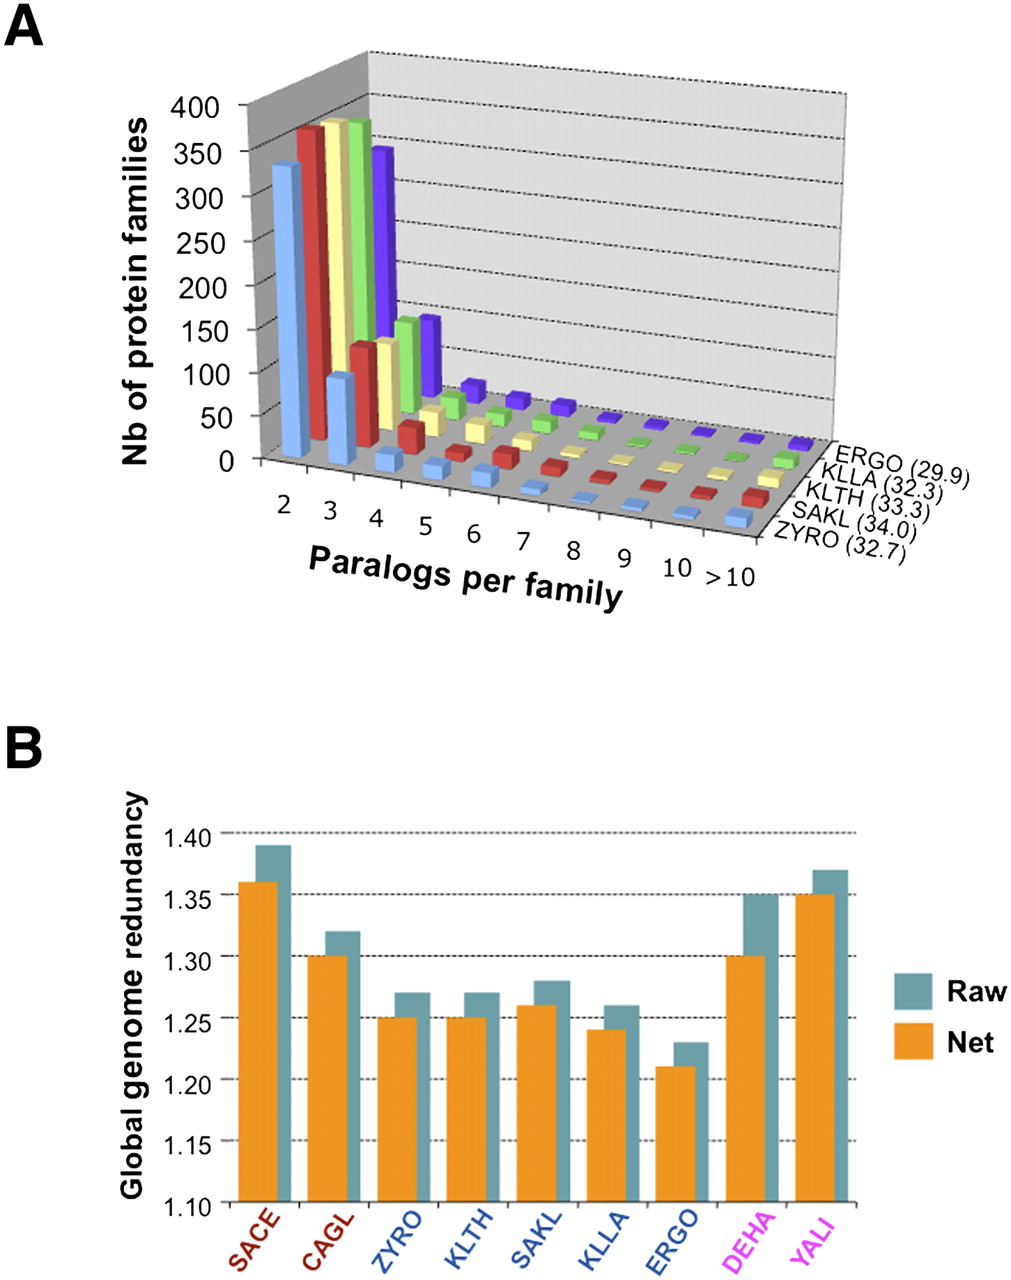
Genome redundancy. (A) Shown for each yeast species is the total number of protein families distributed according to their size (nb of paralogs per family; families of one member are not shown). The proportion (in percent) of the number of CDS belonging to multigene families to the total number of CDS is indicated in brackets next to the species abbreviation. (B) Compared genome redundancies for all nine yeast genomes. (SACE) S. cerevisiae; (CAGL) C. glabrata; (ZYRO) Z. rouxii; (KLTH) K. thermotolerans; (SAKL) S. kluyveri; (KLLA) K. lactis; (ERGO) A. gossypii; (DEHA) D. hansenii; (YALI) Y. lipolytica. Global genome redundancy is calculated as the ratio of total number of protein-coding genes in a genome vs. the total number of protein families in the same species. Raw redundancy counts all gene copies within tandem gene arrays (TGA); net redundancy considers only one gene-equivalent per TGA.


