
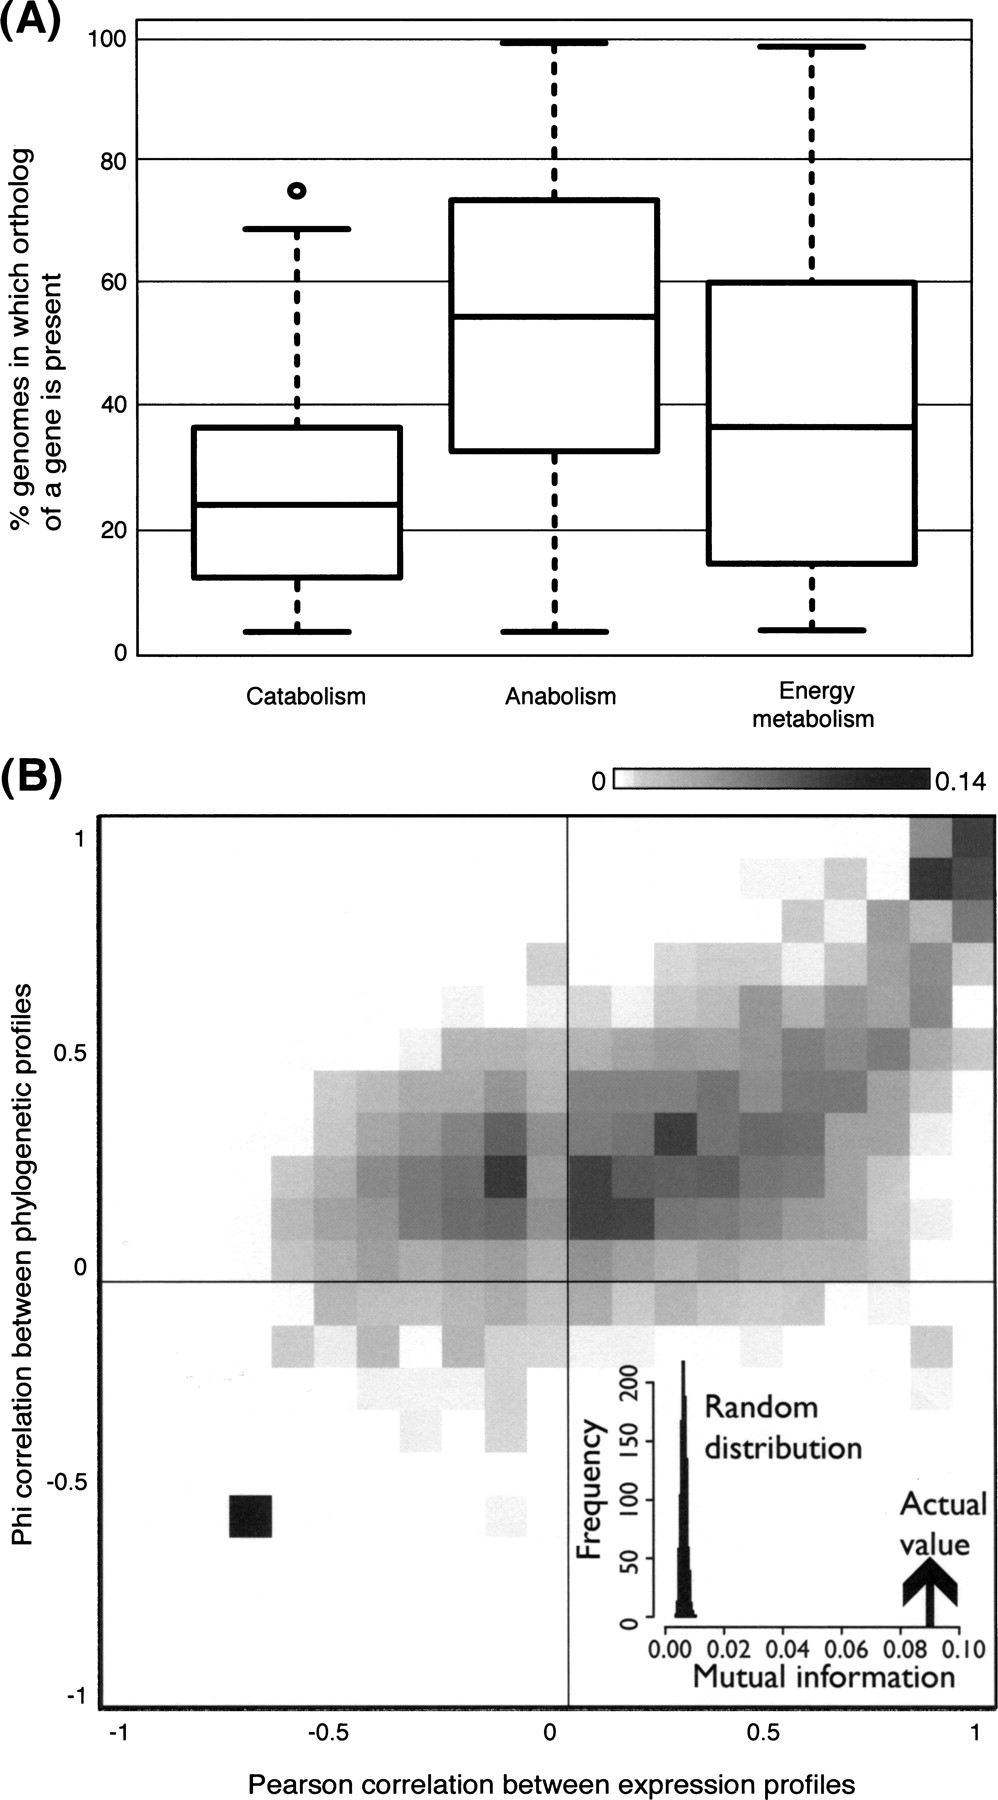
Figure 6.
Conservation and coexpression of metabolic enzymes across 380 bacterial genomes. (A) Box plot of proportion of genomes containing orthologs of catabolic, anabolic, and central energy enzymes. (B) Scatterplot between the Pearson correlation coefficients measuring coexpression and Phi correlation measuring coevolution of enzyme pairs. Data points are shaded according to a normalized proportion of observations in the data set, with darker shades representing higher proportions. (Inset) The density distribution displays the mutual information between the two sets of correlations for the actual data and random expectation from 1000 simulations.


