
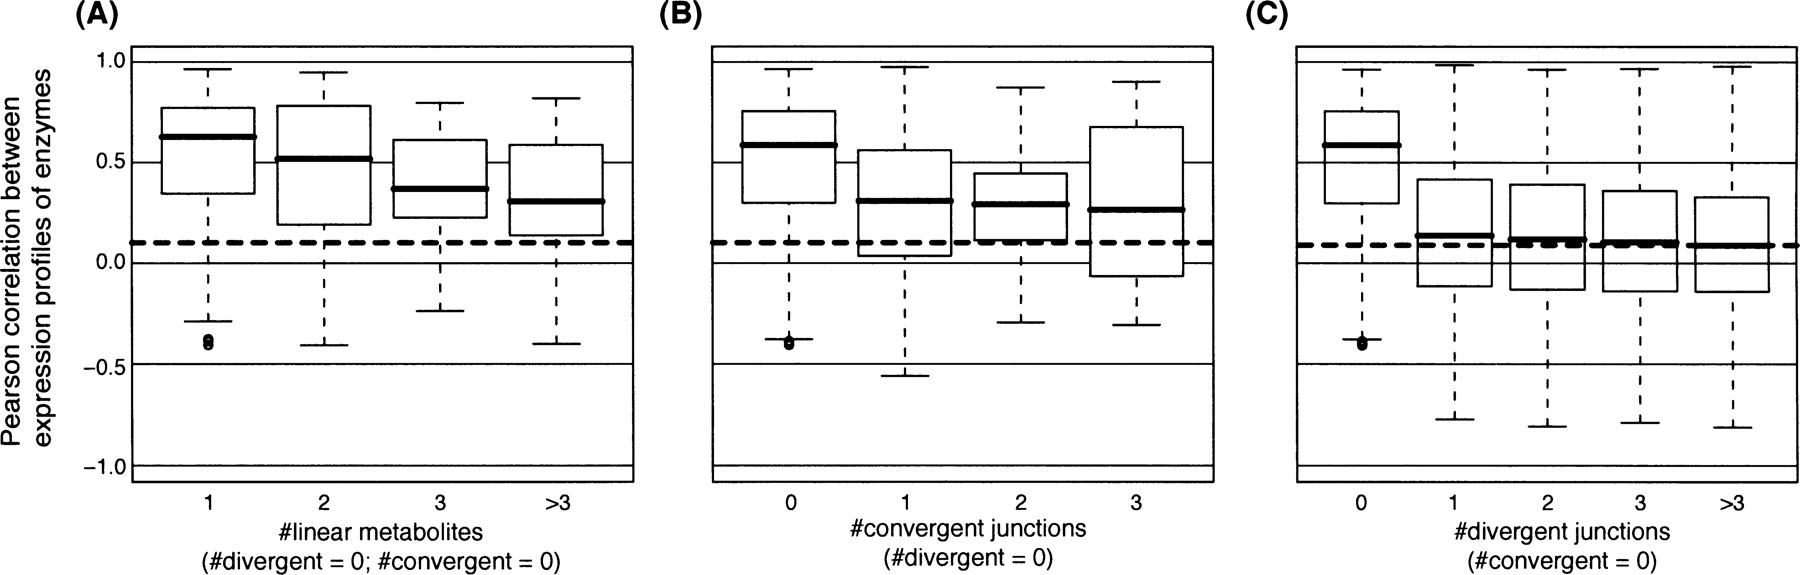
Figure 5.
Coexpression of enzyme pairs at different levels of separation in the metabolic network. Box plots of Pearson correlation coefficients for gene expression profiles between enzyme pairs separated by different numbers of (A) linear metabolites, (B) convergent junctions, and (C) divergent junctions. There is an upper limit of three intermediate convergent junctions in the metabolic network. The horizontal dashed line displays the median correlation for all pairs of enzymes.


