
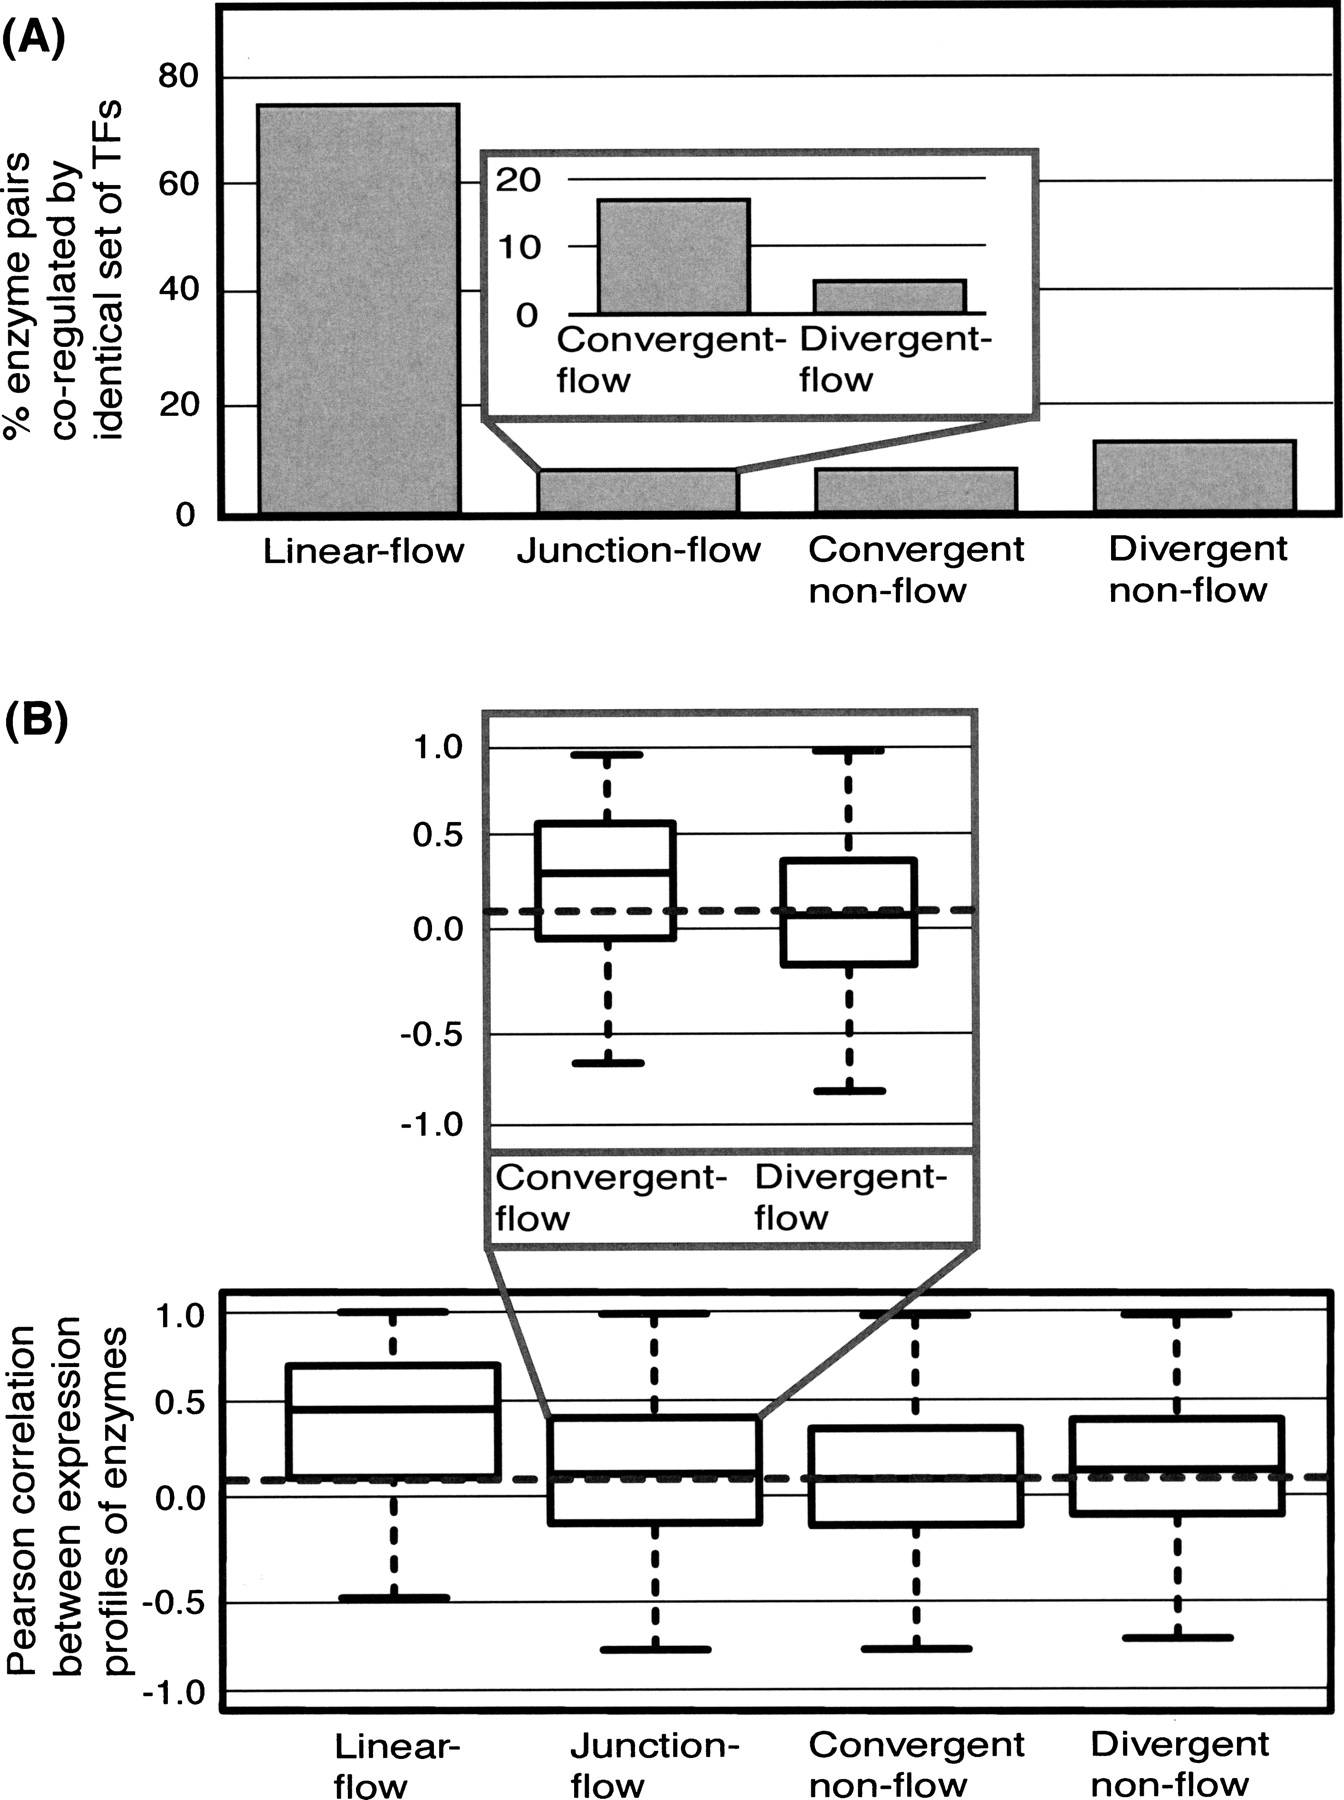
Figure 4.
Co-regulation and coexpression of metabolic enzyme pairs. (A) Histogram of numbers of pairs of enzymes that are co-regulated by identical sets of TFs in the regulatory network. (B) Box plot of distributions of Pearson correlation coefficients for gene expression profiles of enzyme pairs. The horizontal dashed line displays the median correlation for all pairs of enzymes in the metabolic network.


