
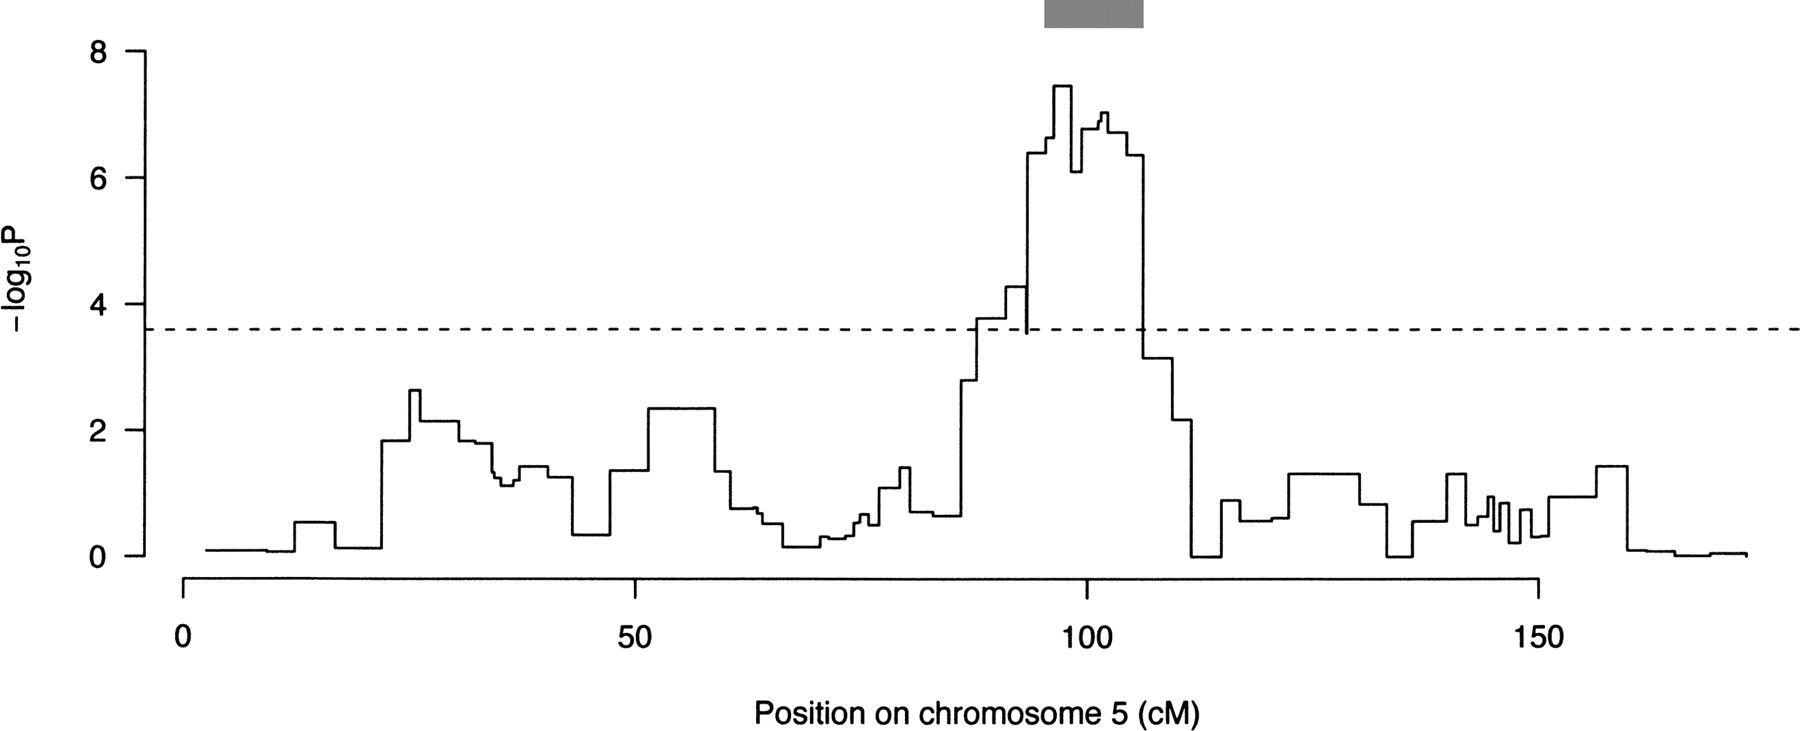
Figure 2.
Genetic mapping of shuttle box avoidances on chromosome 5. The solid line shows the strength of association (y-axis) between the phenotype and the estimated haplotypes at each locus. The x-axis gives the location on chromosome 5 in megabases. The y-axis units are the P-values, expressed as negative logarithms to the base 10 (i.e., logPs), from the likelihood ratio test of association. A conservative 5% chromosome-wide significance threshold was calculated by simulation (dashed line) to help interpret these values. The 95% confidence interval of the QTL (93.37–106.16 Mb), determined by positional bootstrapping (see Methods), is shown as a gray bar.


